Archive

A digital financial chart showing fluctuating stock market graphs, numerical data, and bar charts in blue tones, representing economic trends and market analysis.
  • October 7, 2022

Daily Market Price Update and Commentary 7th October 2022

No.11 market opened at 18.31, 15 points below the previous day’s...

Close-up of green soybean pods on a plant with blurred foliage in the background. Text overlay on a translucent green box reads “Walter Cronin.”.
  • October 7, 2022

Soybean Oil Prices Set to Rise

Opinions Focus The US biofuel industry is using increasing amounts of ...

Two white silhouette figures in front of a blue circle, with a speech bubble containing a question mark above them, all on a dark blue background.
  • October 7, 2022

Ask the Analyst: Was the October Raw Sugar Futures Expiry Bullish?

Insight Focus The October raw sugar futures expired at a premium to th...
Digital display of stock market data with fluctuating line graphs, bar charts, numbers, and financial indicators against a blue background, representing financial analysis and market trends.
  • October 6, 2022

Daily Market Price Update and Commentary 6th October 2022

Recent activity has seen the market pull back to the 18c area, and des...
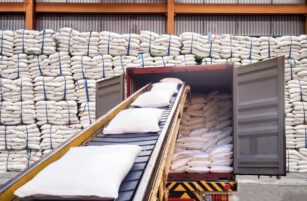
A conveyor belt with bags in a warehouse.
  • October 6, 2022

Can India Export Sugar Today? 6th October 2022

Insight Focus The INR has stopped weakening this week, unable to break...

A large cargo ship loaded with colorful shipping containers sails through calm blue ocean waters, creating a wake behind it, viewed from above.
  • October 6, 2022

Shipping Industry Gears Up For New Emissions Rules

Opinion Focus The EU’s Emissions Trading Scheme will be extended to ...

Logo with an orange gradient circle containing the white lowercase letters um next to the word Trading in dark blue text on a white background.
  • October 6, 2022

Molasses Markets Take a Pause

Opinions Focus New crop Indian molasses should keep the market well-su...
A digital screen displays fluctuating stock market graphs, numerical data, candlestick charts, and bar graphs, all in shades of blue, representing financial analysis and market activity.
  • October 5, 2022

Daily Market Price Update and Commentary 5th October 2022

With the notable exception of some metals contracts the macro picture ...

A black background with a blue-and-white globe icon on the left, the text TechCom Market Reports in white, and a rising blue line graph on the right.
  • October 5, 2022

TechCom Forex Review Wednesday 5th October 2022

For more than twenty years TechCom has been providing insightful techn...

A view looking up at a tall tree with a thick trunk and branches spreading outward, covered in bright green leaves against a sunny sky. Surrounding trees and foliage add to the lush, vibrant canopy above.
  • October 5, 2022

What are Carbon Offsets and What are they Used For?

Carbon offsets represent reductions in greenhouse gas emissions made t...

A cluster of ripe yellow bananas hangs from a tree, surrounded by vibrant green banana leaves in a lush outdoor setting.
  • October 5, 2022

Hurricane Fiona Damages Banana and Cacao production in Dominican Republic

Insight Focus 10% of the Dominican banana crop could be damaged. 4,000...
Blue digital display of financial data with fluctuating stock market graphs, numbers, and bar charts, indicating market activity and trends. The image includes line graphs and various financial statistics.
  • October 4, 2022

Daily Market Price Update and Commentary 4th October 2022

The lower levels drew out some initial buying however the market didnâ...

Download the app

For global insights, logistics, reporting and much more…