Archive

A well-lit refrigerator in a store displays a variety of bottled and canned beverages, including sodas, energy drinks, bottled water, and juices, neatly organized on several shelves behind glass doors.
  • August 8, 2022

Sugar Statshot: Production Grows in 2022/23 but Weather Risk Intensifies

Insight Focus The production surplus in 2022/23 has grown. Good water ...
A close-up of a digital candlestick chart showing fluctuating stock prices and trend lines on a dark background, representing financial market data or trading analysis.
  • August 5, 2022

Daily Market Price Update and Commentary 5th August 2022

There was some light buying around for the opening today and while the...

A graphic of two overlapping white human silhouettes on a blue circle, with a speech bubble containing a question mark above them, set against a dark blue background.
  • August 5, 2022

Ask the Analyst: Why Is the Chinese Sugar Import Margin Stuck in the Red?

Insight Focus Chinese raw sugar import margins have mostly been negati...
A digital display of a financial candlestick chart shows trading activity with blue and white bars, trend lines, and data points on a dark background, representing market analysis or stock performance.
  • August 4, 2022

Daily Market Price Update and Commentary 4th August 2022

A lower opening was quickly picked up, and though there was little imp...
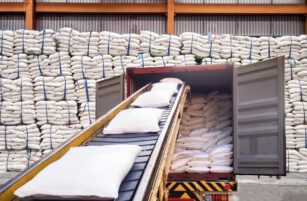
A conveyor belt transfers white sacks into a shipping container, with stacks of similar sacks piled high in the background inside a warehouse.
  • August 4, 2022

Can India Export Sugar Today? 4th August 2022

Insight Focus An extra 1.2m tonnes of Indian sugar exports may be perm...
A close-up of a financial candlestick chart showing price fluctuations, data points, and trend lines on a dark background, commonly used for stock or cryptocurrency market analysis.
  • August 3, 2022

Daily Market Price Update and Commentary 3rd August 2022

There was against some early selling (lack of buying) for the No.11 to...
A digital display of financial data shows fluctuating stock market graphs, numeric values, and bar charts on a blue background, representing economic analysis and trading activity.
  • August 2, 2022

Daily Market Price Update and Commentary 2nd August 2022

A volatile opening saw Oct’22 swing from 17.72 to 17.42 across the f...
A digital screen displays fluctuating financial stock charts, line graphs, numbers, and bar graphs in shades of blue, representing market data and economic trends.
  • August 1, 2022

Daily Market Price Update and Commentary 1st August 2022

  The new month commenced with some light buying taking Octâ...
Close-up of an LED digital screen displaying blue and white numbers, possibly stock prices, with warm, blurred city lights in the background. The image has a bokeh effect, creating an abstract urban atmosphere.
  • August 1, 2022

Sugar Futures and Market Data: 1st August 2022

Insight Focus The No.11 remains close to its 12 month low. Consumers h...
A digital screen displays fluctuating blue financial graphs, stock market charts, and bar graphs, overlaid with numbers and dates, representing market performance and trading activity.
  • July 29, 2022

Daily Market Price Update and Commentary 29th July 2022

There was early buying for the market today, possibly encouraged by pl...

A white silhouette of a person with a question mark in a speech bubble above their head is shown against a blue circle and dark blue background, suggesting inquiry or asking a question.
  • July 29, 2022

Will Tankage Availability Become an Issue For Brazilian Ethanol?

Mills are looking to hold as much ethanol as possible. The rationale i...

Green sugarcane plants growing in a field at sunset, with the sun casting a warm golden light over the landscape.
  • July 28, 2022

Crush Pace Accelerates at CS Brazil

Cane crush advances in the first half of July, registering 46 million ...

Download the app

For global insights, logistics, reporting and much more…