Archive

A close-up of a digital financial chart showing candlestick patterns, trend lines, and data points on a dark background, representing stock market or cryptocurrency trading activity.
  • May 19, 2022

Daily Market Price Update and Commentary 19th May 2022

A weaker opening was swiftly gathered up by defensive buying and Julâ€...

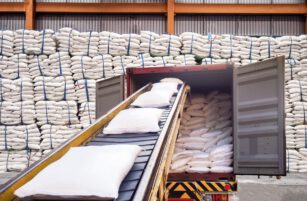
A conveyor belt moves white sacks into a shipping container in a warehouse, with stacks of similar white sacks piled high in the background.
  • May 19, 2022

Can India Export Sugar Today? 19th May 2022

Insight Focus There is up to 1m tonnes of export volume left uncontrac...
A digital chart with blue candlestick patterns and trend lines on a dark background, representing financial or stock market data analysis.
  • May 19, 2022

Daily Market Price Update and Commentary 18th May 2022

  A weaker opening was swiftly gathered up by defensive buyi...

A farmer drives a red tractor with blue attachments through a green field under a cloudy sky, preparing or tending to crops.
  • May 19, 2022

Farmer Diaries (Thailand): High Returns On Cassava

Insight Focus In this series, we’re following farmers around the wor...
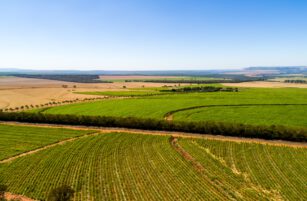
Aerial view of vast, green agricultural fields divided by dirt roads and tree lines under a clear blue sky, with distant hills on the horizon.
  • May 18, 2022

Why Are Sugarcane Yields in Mexico Declining?

Insight Focus Cane yields in Mexico have been in steady decline. This ...
A digital display of financial data with fluctuating stock market graphs, numerical values, and bar charts in blue tones, representing market trends and financial analysis.
  • May 17, 2022

Daily Market Price Update and Commentary 17th May 2022

The strong pace of recent increase has left many wondering just how mu...

Close-up of a digital display with blue and white stock market numbers, with orange and yellow bokeh lights in the background, creating a vibrant urban atmosphere.
  • May 16, 2022

Sugar Futures and Market Data: 16th May 2022

Insight Focus Sugar speculators continue to lift long positions. Consu...
A well-lit convenience store refrigerator filled with assorted bottled and canned drinks, including sodas, juices, energy drinks, and water, organized on multiple shelves behind glass doors.
  • May 16, 2022

Sugar Statshot: 2021/22 Crop Finishes Strongly

Insight Focus Global production in 2021/22 is rounding off to become s...
A close-up of a digital financial chart showing candlestick patterns and trend lines on a dark background, representing stock market data and price fluctuations.
  • May 13, 2022

Daily Market Price Update and Commentary 13th May 2022

Yesterday’s recovery represented the most positive thing to be seen ...

A white silhouette of a person with a question mark in a speech bubble appears over a blue circle background, set against a dark blue backdrop.
  • May 13, 2022

Brazilian Gasoline Prices Caught between Politics and Economics

Brazilian gasoline prices are at record highs, but the oil price, a fa...
Digital illustration of a financial stock market chart with blue graphs, numbers, and data points displayed on a dark background; a bar chart and line graphs indicate market trends and fluctuations.
  • May 12, 2022

Daily Market Price Update and Commentary 12th May 2022

Pressure was applied to the market from the start or trading as sellin...

Download the app

For global insights, logistics, reporting and much more…