Archive

A digital screen displays financial graphs, stock market data, fluctuating line charts, and bar graphs in shades of blue, representing financial analysis and trading activity.
  • September 19, 2023

Daily Market Price Updates and Commentary 19th September 2023

It was another slow start for the market this morning with prices init...
Digital display showing fluctuating financial graphs, stock market data, numbers, and bar charts on a blue background, representing economic trends and trading activity.
  • September 18, 2023

Daily Market Price Updates and Commentary 18th September 2023

Having fallen back sharply from the 27.79 contract high mark on Friday...

A close-up of an LED digital display with blue and white numbers, likely showing stock prices, with blurred city lights and bokeh effects in the background.
  • September 18, 2023

Sugar Futures and Market Data: 18th September 2023

¡Regístrate ahora!   Insight Focus The No.11 sugar futures...

A street view at dusk shows cars passing a Shell gas station. The fuel price sign is visible, and a large purple bus is driving past trees and buildings under a blue-purple sky.
  • September 18, 2023

Guatemala 10% Ethanol Blend Postponed to 2025

Regístrate ahora!  Insight Focus Guatemala will adopt a 10% etha...
A digital stock market chart with blue graphs, fluctuating lines, bar charts, and various financial data and numbers displayed on a dark background.
  • September 15, 2023

Daily Market Price Updates and Commentary 15th September 2023

Today No.11 market opened at 26.93, 5 points below yesterday’s settl...

An icon of two white silhouettes of people, with one in front of the other, set against a blue circular background. A speech bubble with a blue question mark appears above the front silhouette.
  • September 15, 2023

Ask the Analyst: Is China Destocking Its Sugar Reserves?

Insight Focus China Reserve Exchange’s announcement sparked speculat...
Digital stock market display with blue graphs, fluctuating lines, numbers, and bar charts, representing financial data, trading activity, and economic trends. The background features a grid and calendar months.
  • September 14, 2023

Daily Market Price Updates and Commentary 14th September 2023

No.11 began the day positively with an initial push up to 27c, the spe...
A digital financial chart showing fluctuating blue line graphs, bar charts, and various numerical data points against a dark grid background, representing stock market activity and trends.
  • September 13, 2023

Daily Market Price Updates and Commentary 13th September 2023

It was a familiar pattern of morning trading for No.11 as initial stab...

Close-up view of four fuel pump nozzles at a gas station, with two yellow and two green handles, arranged side by side and ready for refueling vehicles.
  • September 13, 2023

CS Brazil: Sugar or Ethanol? 12th September 2023

Regístrate ahora!   This report is updated weekly, for daily inf...
Blue digital financial graph with fluctuating lines, numbers, and bar charts overlaid on a dark grid background, representing stock market data and economic analysis.
  • September 12, 2023

Daily Market Price Updates and Commentary 12th September 2023

Recent sessions have seen the whites take more of a backseat in the su...
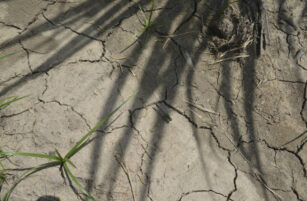
Cracked, dry soil with scattered green grass blades and long, striped shadows cast across the surface.
  • September 12, 2023

Louisiana Drought Situation Worsens, USDA Says

This update is from Sosland Publishing Co.’s weekly Sweetener Report...
Digital illustration of a financial stock market chart with blue graphs, fluctuating lines, bar graphs, numbers, and dates, representing trading activity and market analysis on a dark background.
  • September 11, 2023

Daily Market Price Updates and Commentary 11th September 2023

Having seen plenty of volatility between 26/27c last week the market o...

Download the app

For global insights, logistics, reporting and much more…