Archive

A digital financial chart with blue graphs, candlesticks, and data points showing stock market fluctuations over time, overlaid on a dark background with numerical values and bar charts.
  • July 5, 2023

Daily Market Price Updates and Commentary 5th July 2023

Nearby London white’s contracts had recorded solid gains while No.11...

Tall green sugarcane plants grow densely together, stretching across the background, while the foreground shows patches of grass and bare, uneven soil under a pale sky.
  • July 5, 2023

ATR (Cane Price) In Brazil Maintains Uptrend

Main points As expected, the rise in sugar prices had a positive impac...

Four fuel pump nozzles are lined up at a gas station, two are yellow and two are green, each attached to their hoses and resting in their holders, ready for use.
  • July 4, 2023

CS Brazil: Sugar or Ethanol? 5th July 2023

This report is updated weekly, for daily information refer to our Inte...
A digital display of financial data showing fluctuating line graphs, bar charts, and numbers representing stock market activity. The background is blue and features dates and financial indicators.
  • July 4, 2023

Daily Market Price Updates and Commentary 4th July 2023

With No.11 closed for the Independence day holiday there was always li...

A black background with a globe icon on the left and the text “TechCom Market Reports” beside it. To the right, a blue rising line graph symbolizes growth or an upward trend.
  • July 4, 2023

Sugar: With July Gone, How Do You Like Me Now?

Every effort has been made to ensure accuracy but no guarantee is offe...
A digital financial chart displays fluctuating stock prices with line graphs, numbers, bar graphs, and data points on a blue background, representing market trends and economic data analysis.
  • July 3, 2023

Daily Market Price Updates and Commentary 3rd July 2023

The market started strongly with a surge through 23c for Oct’23, las...

A close-up of a digital display with blurred blue and white numbers, alongside orange bokeh lights in the background, suggesting a financial or stock market setting at night.
  • July 3, 2023

Sugar Futures and Market Data: 3rd July 2023

Insight Focus Raw sugar futures have fallen sharply in the last week. ...

A blue and white globe icon on the left, followed by the text TechCom Market Reports on a black background with a blue gradient line and an upward trending arrow on the right.
  • July 3, 2023

Raws and Whites Drop Out of Q2 Top Formations

Every effort has been made to ensure accuracy but no guarantee is offe...
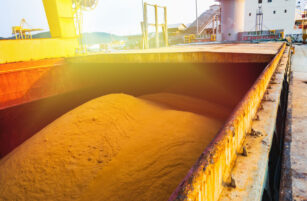
A large industrial ship holds a cargo of yellow granular material, possibly sand or grain, in an open container, docked at a port with equipment and safety signs visible in the background.
  • July 3, 2023

Has China Acted Amid Raw Sugar Futures Correction?

Insight Focus China’s sugar arrivals in first half 2023 are low....
A digital screen displays financial data with candlestick and line charts, bar graphs, and various numbers representing stock market activity over time. Blue tones dominate, suggesting analysis and trading.
  • June 30, 2023

Daily Market Price Updates and Commentary 30th June 2023

A mildly firmer opening quickly became a far stronger start as Oct’2...

A simple graphic of two white user silhouettes on a blue circle background, with a speech bubble containing a blue question mark above them, all set against a dark blue backdrop.
  • June 30, 2023

Ask the Analyst: At What Price Will Chinese Refiners Buy Raw Sugar?

Insight Focus China is a major raw sugar buyer. Raw sugar futures have...
A digital screen displays a blue financial graph with fluctuating lines, numerical data, and bar charts, representing stock market activity and economic trends.
  • June 29, 2023

Daily Market Price Updates and Commentary 29th June 2023

The day started more calmly than recent sessions with another assortme...

Download the app

For global insights, logistics, reporting and much more…