
Archive

A warehouse filled with stacks of large white sacks, overlaid with a transparent world map and curved lines connecting bright points, symbolizing global distribution and logistics.
  • May 23, 2023

Czapp Q2 Sugar Webinar: ‘Global sugar prices are at a decade high, what is going on?’

We recently presented a webinar on why sugar prices have strengthened ...

A large industrial port with cargo ships docked, cranes, and warehouses, overlaid with digital network graphics representing connectivity and technology integration in maritime logistics.
  • May 23, 2023

8 Ways Technology Can Optimize Shipping

Insight Focus The shipping industry is facing unprecedented environmen...

A digital screen displays fluctuating financial graphs, stock market numbers, and bar charts in blue tones, indicating market data and trading activity.
  • May 22, 2023

Daily Market Price Updates and Commentary 22nd May 2023

There was early buying to being the week positively, as Jul’23 was b...

Close-up of an electronic digital display with blue and white numbers, likely showing stock market data, with blurred city lights in the background.
  • May 22, 2023

Sugar Futures and Market Data: 22nd May 2023

Insight Focus Raw and refined sugar futures prices have traded sideway...

A digital stock market chart showing fluctuating lines, numerical data, candlestick patterns, and bar graphs over a blue grid background, representing financial trading and market analysis.
  • May 19, 2023

Daily Market Price Updates and Commentary 19th May 2023

Following three successive days of downward movement it seemed that we...

A white silhouette of a person with a shadow, shown in front of a blue circle on a dark blue background. A speech bubble with a blue question mark is above the figures left shoulder.
  • May 19, 2023

Ask the Analyst: What Might El Niño Mean for Brazilian Cane?

Insight Focus El Nino typically causes warmer weather in Centre-South ...

Abstract digital image showing fluctuating financial graphs, stock market candlesticks, numbers, and grid lines on a blue background, representing market data and economic trends.
  • May 18, 2023

Daily Market Price Updates and Commentary 18th May 2023

The past two days have seen some of the sheen removed from the market,...
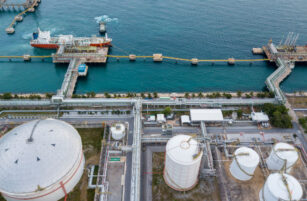
Aerial view of an industrial port facility with large fuel storage tanks, pipelines, and a docked tanker ship connected to the shore by a long jetty over clear blue water.
  • May 18, 2023

Alternative Marine Fuels Series Wrapped Up

Insight Focus The shipping industry currently uses about 300 million t...

A digital display of stock market data with fluctuating line graphs, numbers, and bar charts on a blue background, representing financial analysis and trading activity.
  • May 17, 2023

Daily Market Price Updates and Commentary 17th May 2023

Early trading took place either side of unchanged values, however it w...

Close-up of fuel pump nozzles at a gas station, with two yellow and two green handles, arranged in a row and ready for fueling vehicles.
  • May 17, 2023

CS Brazil: Sugar or Ethanol? 17th May 2023

This report is updated weekly, for daily information refer to our Inte...

Thick black smoke rises from industrial chimneys over a town at sunset, with haze and silhouettes of trees and buildings in the background, highlighting air pollution.
  • May 17, 2023

What is the Carbon Border Adjustment Mechanism?

Insight Focus Importers of carbon-intensive materials to the EU will p...

Digital financial chart displaying fluctuating stock market data, with blue graphs, numerical values, bar charts, and line graphs over a dark background. The scene suggests financial analysis and market trends.
  • May 16, 2023

Daily Market Price Updates and Commentary 16th May 2023

Opening lows at 26.17 were quickly forgotten as early buying helped Ju...

Download the app

For global insights, logistics, reporting and much more…