
Archive

A digital graphic of a financial stock market chart with fluctuating blue line graphs, numbers, bar graphs, and dates, representing market activity and financial data analysis.
  • April 26, 2023

Daily Market Price Updates and Commentary 26th April 2023

The new day began steadily with Jul’23 trading either side of 26.00,...

A logo with a globe icon and the text TechCom Market Reports on a black background. A blue line with a rising arrow runs across the image, suggesting upward market trends.
  • April 26, 2023

TechCom Forex Review Wednesday 26th April 2023

Every effort has been made to ensure accuracy but no guarantee is offe...

Four fuel pump handles at a gas station, with two yellow nozzles and two green nozzles, are lined up in a row, ready for use.
  • April 26, 2023

CS Brazil: Sugar or Ethanol? 26th April 2023

This report is updated weekly, for daily information refer to our Inte...

Aerial view of a busy port at dusk with many shipping containers, cranes, boats, and brightly lit buildings, surrounded by water and a cityscape in the background.
  • April 26, 2023

Supply Chain Indicators Mixed But Rate Hikes Continue

Insight Focus Interpreting economic indicators has become more and mor...

A hazy industrial landscape with factories and tall smokestacks emitting smoke, partially obscured by smog. Trees with autumn leaves are visible in the foreground.
  • April 26, 2023

EU Carbon Prices Decline as Compliance Season Ends

Insight Focus European carbon prices have fallen below €90 once more...
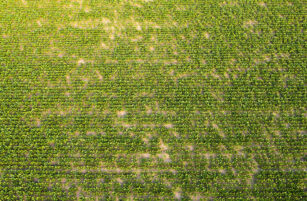
Aerial view of a lush green field with rows of crops planted in neat, parallel lines. Patches of sparse vegetation and bare soil are visible throughout. The sunlight creates bright and shaded areas.
  • April 26, 2023

American Beet Plantings On Track

This update is from Sosland Publishing Co.’s weekly Sweetener Report...

A digital display showing financial data with blue graphs, fluctuating stock market lines, bar charts, and various numerical values on a dark background, representing economic or stock market activity.
  • April 25, 2023

Daily Market Price Updates and Commentary 25th April 2023

Trading commenced with side of unchanged though it was not long before...

A digital screen displaying various financial graphs, charts, and numerical data, including line and bar graphs, indicating stock market activity and economic trends on a blue background.
  • April 24, 2023

Daily Market Price Updates and Commentary 24th April 2023

There was some opening volatility with Jul’23 swinging between 24.06...

Close-up of a digital display with blue and white numbers, likely representing stock market or financial data, with blurred city lights in the background creating a bokeh effect.
  • April 24, 2023

Sugar Futures and Market Data: 24th April 2023

Insight Focus No.11 raw sugar prices have strengthened over the last w...

A graphic with a globe icon on the left and the text TechCom Market Reports in white on a black background, with a blue upward trending line on the right side.
  • April 24, 2023

TechCom Core Commodity Review Monday 24th April 2023

Every effort has been made to ensure accuracy but no guarantee is offe...

White stylized zebra head icon followed by the word fertiMetrics in white text, all set against a solid red background.
  • April 24, 2023

Urea Prices Again Under Pressure With The US Season Coming To A Halt

Insight Focus Processed phosphate prices keep on falling bar the US ma...

Stacks of large white bags in a warehouse with a faint world map overlay and connected points, symbolizing global logistics, supply chain, and distribution networks.
  • April 24, 2023

How External Markets Are Influencing Sugar

Insight Focus I presented at the S&P Global Sugar Conference in Ge...

Download the app

For global insights, logistics, reporting and much more…