
Archive

A digital illustration of a world map in a wireframe globe with glowing lines and numbers, overlaid by a rising financial candlestick chart, symbolizing global finance and economic growth.
  • April 6, 2023

Czapp Explains: How Futures Markets Are Used

Welcome to the second instalment of Czapp’s course on the future...

A logo featuring a globe next to the text TechCom Market Reports on a black background, with a thin blue line and an upward-trending arrow to the right, symbolizing growth or progress.
  • April 6, 2023

TechCom Forex Review Thursday 6th April 2023

Every effort has been made to ensure accuracy but no guarantee is offe...
A digital screen displays blue financial graphs, stock market charts, numerical data, and bar graphs, representing market trends and economic analysis.
  • April 5, 2023

Daily Market Price Updates and Commentary 5th April 2023

A mixed opening period saw May´23 trading between 22.41 and 22.55, st...

Aerial view of a dense, green forest canopy with tall trees and patches of mist or fog drifting across the treetops. The scene displays varying shades of green and a lush, natural landscape.
  • April 5, 2023

Carbon Offset Council Publishes Initial Criteria for High-Quality Credits

Insight Focus Criteria sets out principles for carbon credits leading ...
Close-up of four fuel pump nozzles at a gas station, with two yellow and two green handles, set against a blurred background.
  • April 5, 2023

CS Brazil: Sugar or Ethanol? 05th April 2023

This report is updated weekly, for daily information refer to our Inte...
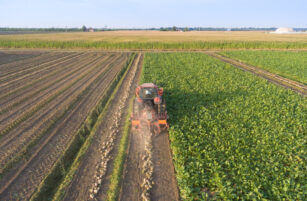
Aerial view of a tractor harvesting crops in a large, green field divided into rows, with dust rising behind the machine and wide farmland stretching into the distance under a clear sky.
  • April 5, 2023

USDA Forecasts Lowest Beet Acreage Since 2008

This update is from Sosland Publishing Co.’s weekly Sweetener Report...
Digital display showing various stock market charts, line graphs, numerical data, and bar graphs in blue tones, representing financial trends and market analysis.
  • April 4, 2023

Daily Market Price Updates and Commentary 4th April 2023

The day started lower with May´23 trading down to 22.22, however such...
A digital graphic shows a blue bar chart with increasing, fluctuating bars and a red line graph trending upward, ending with an arrow, on a dark blue grid background, representing financial or stock market growth.
  • April 4, 2023

Czapp Explains: What is a Futures Market?

Welcome to the first instalment of Czapp’s course on the futures mar...
A digital display showing blue financial charts, line graphs, bar graphs, and numbers, representing stock market data and fluctuations against a dark background.
  • April 3, 2023

Daily Market Price Updates and Commentary 3rd April 2023

On Friday there was some expectation that having reached the continuat...

Close-up of a digital LED display showing blue numbers, possibly stock market data, with blurred city lights and bokeh effect in the background, creating a dynamic and vibrant urban atmosphere.
  • April 3, 2023

Sugar Futures and Market Data: 3rd April 2023

Insight Focus No.11 raw sugar futures closed last week at 22.3c/Ib. K/...

A graphic with a globe icon on the left and the text TechCom Market Reports on a black background, with a blue line and upward arrow suggesting growth or progress.
  • April 3, 2023

TechCom Core Commodity Review Monday 3rd April 2023

Every effort has been made to ensure accuracy but no guarantee is offe...

Aerial view of a large green cargo ship docked at an industrial port, surrounded by storage tanks and pipelines near the water.
  • April 3, 2023

How to Replace 300 Million Tonnes of Fuel Oil

Insight Focus The shipping industry currently uses about 300 million t...

Download the app

For global insights, logistics, reporting and much more…