
Archive

Illustration of global logistics showing a map with cargo ship, airplane, and trucks transporting containers across continents, connected by dotted lines representing international shipping routes.
  • February 22, 2023

Why China is a Crucial Link in The Food Supply Chain

Insight Focus Activity in China is often cited as a key indicator of g...

Close-up of a digital stock market ticker display showing blue and white numbers, with blurred city lights and bokeh effect in the background.
  • February 22, 2023

Sugar Futures and Market Data: 22nd February 2023

Insight Focus Both raw and refined sugar futures broadly traded sidewa...

Four fuel pump nozzles at a gas station, two with yellow handles and two with green handles, are lined up side by side, ready for use.
  • February 22, 2023

CS Brazil: Sugar or Ethanol? 22nd February 2023

This report is updated weekly, for daily information refer to our Inte...

A digital display of stock market data showing fluctuating graphs, numerical values, and bar charts in blue tones, representing financial market trends and trading information.
  • February 21, 2023

Daily Market Price Updates and Commentary 21st February 2023

Reacting to a positive macro and moderately higher May’23 whites pri...

Digital illustration of a financial stock market graph with fluctuating lines, numerical data, bar charts, and dates over a blue background, representing economic trends and financial analysis.
  • February 20, 2023

Daily Market Price Updates and Commentary 20th February 2023

With US markets closed for Presidents Day and few resting orders there...

A graphic with a globe icon on the left, TechCom Market Reports text in the center, and an upward trending blue line on a black background, symbolizing market growth or analysis.
  • February 20, 2023

TechCom Core Commodity Review Monday 20th February 2023

Every effort has been made to ensure accuracy but no guarantee is offe...

White zebra head graphic next to the text “fertiMetrics” on a bright red background.
  • February 20, 2023

Fertiliser Prices Under Enormous Pressure

Insight Focus Urea prices continue to tumble. Some hope for Urea produ...

A digital financial chart displays fluctuating blue stock market graphs, numbers, and data points overlaid on a dark background, with bar graphs and line charts representing market trends and activity.
  • February 17, 2023

Daily Market Price Updates and Commentary 17th February 2023

With the macro again weaker there was some possibility that the market...

Two white silhouette figures on a blue circle background, with a speech bubble containing a question mark above them, set against a dark blue backdrop.
  • February 17, 2023

Ask the Analyst: Why Are European Sugar Imports So Strong?

Insight Focus EU-27 sugar imports are the highest in 6 years. Sugar pr...

Digital illustration of a stock market chart displaying fluctuating line graphs, bar charts, and numerical data with a blue color scheme, representing financial trends and market analysis.
  • February 16, 2023

Daily Market Price Updates and Commentary 16th February 2023

A negative macro picture was disregarded as May’23 continued this we...

A conveyor belt loads large white sacks into a shipping container, with stacks of similar sacks piled high in the background inside a warehouse.
  • February 16, 2023

Can India Export Sugar Today? 16th February 2023

Insight Focus The Indian 2022/23 sugar crop could finish below expecta...
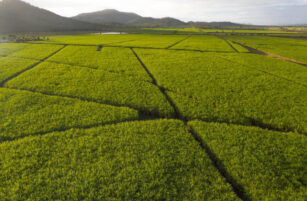
Aerial view of lush green fields divided into rectangular sections, with distant hills and a cloudy sky in the background.
  • February 16, 2023

Farmer Diaries (Australia): New Cane Varieties Looking Good

Insight Focus New cane crop varieties look very promising. Weed manage...

Download the app

For global insights, logistics, reporting and much more…