
Archive

A digital display showing financial data with fluctuating stock market graphs, numerical values, and bar charts, representing market trends and economic analysis. The image uses shades of blue for a modern, high-tech look.
  • January 10, 2023

Daily Market Price Updates and Commentary 10th January 2023

Another mixed start for the market saw March’23 trading within a few...

Two cut pieces of sugarcane, three small sugarcane segments, a green leaf, and a pile of raw brown sugar are arranged on a white background.
  • January 10, 2023

The American Sugar Market’s Quiet End to 2022

This update is from Sosland Publishing Co.’s weekly Sweetener Report...

A dark background features a globe icon on the left and the text TechCom Market Reports next to it. A blue line runs across the image, ending with an upward-pointing arrow, suggesting growth.
  • January 10, 2023

TechCom Core Commodity Review Tuesday 10th January 2023

Every effort has been made to ensure accuracy but no guarantee is offe...

Digital screen displaying fluctuating stock market charts, graphs, numbers, and data, with line graphs and bar graphs illustrating market trends and financial activity in blue tones.
  • January 9, 2023

Daily Market Price Updates and Commentary 9th January 2023

There was mixed activity during the first hour with prices edging eith...

Close-up of a digital LED display showing blurred numbers, with warm bokeh lights in the background, creating an abstract, urban nighttime scene.
  • January 9, 2023

Sugar Futures and Market Data: 9th January 2023

Insight Focus Raw and refined sugar futures have declined so far in 20...

A white zebra head logo next to the word fertiMetrics in white text on a solid red background.
  • January 9, 2023

Urea Prices Continue to Fall

Insight Focus India has delayed a spot tender for urea. Demand is also...

A digital screen showing financial charts, graphs, and numerical data with fluctuating stock market lines and bar graphs in blue tones, representing market analysis and trading activity.
  • January 6, 2023

Daily Market Price Updates and Commentary 6th January 2023

Initial hedge lifting meant a marginally higher opening though this wa...

A simple graphic of two white user silhouettes on a blue circle background, with a speech bubble containing a question mark above them, all set against a dark blue backdrop.
  • January 6, 2023

Ask The Analyst: How Is The Start Of Thailand’s Cane Crush?

Opinions Focus Thailand should crush 98.5m tonnes of cane this season....

Digital illustration of a financial stock market chart with glowing blue lines and bar graphs, showing fluctuating data, numbers, and a calendar timeline overlayed on a dark grid background.
  • January 5, 2023

Daily Market Price Updates and Commentary 5th January 2023

The market picked back up where it had left off with morning support b...
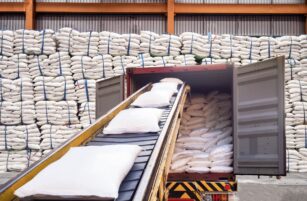
A conveyor belt transports large white sacks into a shipping container inside a warehouse, with stacks of similar sacks piled high in the background.
  • January 5, 2023

Can India Export Sugar Today? 5th January 2023

Insight Focus Almost 1m tonnes of Indian sugar shipped last month, the...

Close-up of green soybean pods on a plant in a sunlit field, with leaves and stems visible and the warm glow of the setting sun in the background.
  • January 5, 2023

Argentine Drought Slashes Soybean Production

Insight Focus Drought in Argentina to decrease soybean production. Ani...

A digital screen displays financial charts and graphs with fluctuating stock prices, numerical data, line graphs, and bar charts, representing stock market activity and financial analysis.
  • January 4, 2023

Daily Market Price Updates and Commentary 4th January 2023

The day began in subdued fashion with the market nudging slightly lowe...

Download the app

For global insights, logistics, reporting and much more…