
Archive

A digital financial chart with blue lines showing fluctuating stock prices, numerical data, bar graphs, and grid lines, representing stock market trends and trading activity.
  • March 12, 2024

Daily Market Price Updates and Commentary 12th March 2024

Some light early losses were recorded as grower pricing arrived in rea...

A field of tall green sugarcane plants under a partly cloudy sky at sunset, with the sun low on the horizon and the soil visible in the foreground.
  • March 12, 2024

February Sugar Market Webinar: The EU Sugar Market in 10 Minutes

Insight Focus European sugar production should increase in 2024/25. Th...

Digital illustration of a stock market chart displaying fluctuating line graphs, bar graphs, and numerical data on a dark blue background, representing financial trends and trading activity.
  • March 11, 2024

Daily Market Price Updates and Commentary 11th March 2024

Having opened either side of unchanged the market quickly found some l...

Digital image of a stock market chart showing fluctuating blue line graphs, bar graphs, and financial data, with numbers and dates overlaying a dark background. Represents finance, trading, or economic analysis.
  • March 8, 2024

Daily Market Price Updates and Commentary 8th March 2024

Commencing the day either side of unchanged the market was showing lit...

A white silhouette of a person in front of a blue circle with a speech bubble containing a question mark, all set against a dark blue background.
  • March 8, 2024

Ask The Analyst: Mexico’s Lower Sugar Production, What Are The Impacts?

Insight Focus Mexico is still on track to produce 4.7 million tonnes o...

A digital screen shows fluctuating financial graphs, line charts, numbers, and bar charts, representing stock market data, analysis, and economic trends in shades of blue.
  • March 7, 2024

Daily Market Price Updates and Commentary 7th March 2024

 A sharp opening drop to 21.19 for May’24 was initially gat...
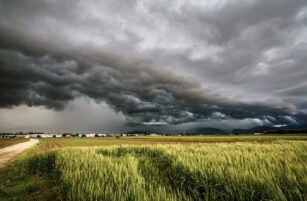
Dramatic dark storm clouds roll over a green wheat field, with a dirt path curving through the landscape. Rain is visible in the distance near a line of low buildings and trees under the stormy sky.
  • March 7, 2024

Farmer Diaries (Australia): Wet Conditions Delay Spraying

Insight Focus Wet conditions in the wake of ex Tropical Cyclone Jasper...

A stack of white sacks is being lifted by a crane near a truck loaded with similar sacks, indicating a loading or unloading process at a warehouse or shipping area during sunset.
  • March 7, 2024

Mexican Sugar Supply in Colloquium Crosshairs

This update is from Sosland Publishing Co.’s weekly Sweetener Report...

A red fuel pump nozzle rests on a pile of corn kernels, with three ears of corn nearby, symbolizing biofuel made from corn.
  • March 7, 2024

Wider E15 Availability To Boost Corn Demand in US

Insight Focus The US EPA has granted a request for the year-round use ...

A digital screen displaying financial charts and graphs, including bar graphs and fluctuating line graphs, with numbers and data points representing stock market or financial performance analytics.
  • March 6, 2024

Daily Market Price Updates and Commentary 6th March 2024

May’24 dropped back to 20.72 on the opening though there was sup...

Close-up of four fuel pump nozzles at a gas station, two with yellow handles and two with green handles, positioned in a row and ready for use.
  • March 6, 2024

CS Brazil: Sugar or Ethanol? 06th March 2024

This report is updated weekly, for daily information refer to our ...

Blue digital screen displaying fluctuating stock market graphs, numerical data, line charts, and bar charts, representing financial analysis and market trends.
  • March 5, 2024

Daily Market Price Updates and Commentary 5th March 2024

Then recent series of downward days has left the market vulnerable to ...

Download the app

For global insights, logistics, reporting and much more…