Archive

A digital financial chart displays blue graphs, line charts, bar graphs, and numerical data on a dark background, representing stock market trends and financial analysis.
  • February 23, 2024

Daily Market Price Updates and Commentary 23rd February 2024

Today No.11 K4 opened at 22.05, 12 points below yesterday’s open...

A graphic of two white silhouettes of people on a blue circle, with a speech bubble containing a question mark above them, set against a dark blue background.
  • February 23, 2024

Ask The Analyst: How’s China’s Sugar Production Going?

Insight Focus 70% of expected Chinese sugar production for this season...
Digital illustration of a financial stock market chart with blue line graphs, numbers, and bar graphs displayed on a dark grid background, representing fluctuating financial data and statistics.
  • February 22, 2024

Daily Market Price Updates and Commentary 22nd February 2024

 Today No.11 H4, opened at 22.73, at the same level of yesterday&...
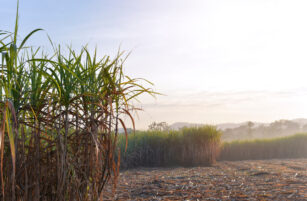
A field of tall green sugarcane plants under a bright sky, with sunlight shining and casting shadows over the dry, harvested ground in the foreground. Trees and distant hills are visible in the background.
  • February 22, 2024

US Sugar Market Firm as Potential Supply Issues Emerge

This update is from Sosland Publishing Co.’s weekly Sweetener Report...
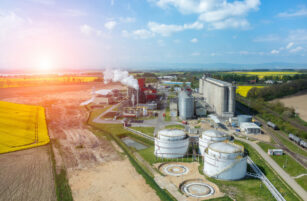
Aerial view of an industrial facility with storage tanks, silos, and buildings emitting steam, surrounded by farmland and yellow fields under a partly cloudy sky with sunlight on the horizon.
  • February 22, 2024

Regulatory, Cultural Obstacles Limit Ethanol Potential in Mexico

Insight Focus Mexico is a major producer of sugar and corn but lags in...
A digital screen displays various stock market charts and graphs with blue lines, numbers, bar graphs, and fluctuating data points representing financial and trading activity.
  • February 21, 2024

Daily Market Price Updates and Commentary 21st February 2023

Today No.11 opened at a big gap with lot of volatility during the 5 fi...
Close-up of four fuel pump handles at a gas station; two are yellow and two are green, indicating different types of fuel options available for vehicles.
  • February 21, 2024

CS Brazil: Sugar or Ethanol? 21st February 2024

This report is updated weekly, for daily information refer to our Inte...
A digital financial chart with fluctuating blue line and bar graphs, numbers, and dates, representing stock market trends and data analysis on a dark background.
  • February 20, 2024

Daily Market Price Updates and Commentary 20th February 2024

Today No.11 H4 opened at 23c, down 8 points from Friday’s settle...
A digital screen displays multiple financial charts, graphs, and stock market data with fluctuating blue line graphs, bar charts, and numerical values against a dark background.
  • February 19, 2024

Daily Market Price Updates and Commentary 19th February 2024

Today K4 opened at $639, up $0.7 from Friday’s settlement. Today...

Close-up of an illuminated digital display board with blue and white numbers, possibly stock prices, and blurred orange city lights in the background.
  • February 19, 2024

Sugar Futures and Market Data: 19th February 2024

Insight Focus The Mar’24 refined sugar futures expired last week...
A digital financial chart displays blue line graphs, bar charts, and numerical data, illustrating stock market trends and fluctuations against a dark background.
  • February 16, 2024

Daily Market Price Updates and Commentary 16th February 2024

Today, in Mar’24, the market opened at 22.85, which was 3 points...

Graphic of two white user silhouettes on a blue circle background, with a speech bubble containing a question mark above them, all set against a dark blue backdrop.
  • February 16, 2024

Ask The Analyst: Will Thailand Meet Sugar Export Forecasts?

Insight Focus We estimate Thailand can export 4.7m tonnes in 2024. Sur...

Download the app

For global insights, logistics, reporting and much more…