Archive

A digital display showing stock market data with fluctuating line graphs, bar charts, and numerical figures in blue tones, representing financial trends and trading activity.
  • February 15, 2024

Daily Market Price Updates and Commentary 15th February 2024

An unchanged opening proved difficult to sustain and it was not long b...
A digital display showing financial data with stock market graphs, blue bar charts, numbers, and fluctuating line graphs, representing market trends and economic analysis.
  • February 14, 2024

Daily Market Price Updates and Commentary 14th February 2024

A first print at unchanged quickly gave way as selling swamped the mar...

Close-up of four fuel pump nozzles at a gas station, with two yellow handles and two green handles, arranged in a row, ready for use.
  • February 14, 2024

CS Brazil: Sugar or Ethanol? 14th February 2024

This report is updated weekly, for daily information refer to our Inte...
A digital display with blue financial graphs, bar charts, and fluctuating stock market data, including numbers and grid lines, representing market trends and economic analysis.
  • February 13, 2024

Daily Market Price Updates and Commentary 13th February 2024

 It was another weak start for May’24 as early trading saw ...
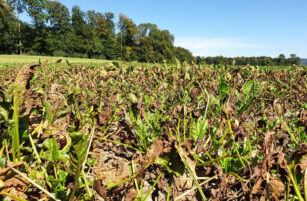
A field of wilted and brown-damaged plants under a clear blue sky, with healthy green trees in the background. The plants appear to be suffering from disease or drought stress.
  • February 13, 2024

US Sugar Prices Firm on Beet Loss Concerns, Activity Uptick

This update is from Sosland Publishing Co.’s weekly Sweetener Re...
A digital display shows fluctuating financial graphs, stock market data, and bar charts on a blue background, representing market trends and economic analysis.
  • February 12, 2024

Daily Market Price Updates and Commentary 12th February 2024

 As the index roll moves towards its end and with daily activitie...

Close-up of a digital stock market ticker display with blue and white numbers, blurred orange city lights in the background, creating a financial and urban atmosphere.
  • February 12, 2024

Sugar Futures and Market Data: 12th February 2024

Insight Focus Raw sugar futures reluctant to break above 24c/Ib. Specu...
A digital screen displays stock market data with fluctuating line graphs, bar charts, and numerical values, representing financial trends and market activity in shades of blue.
  • February 9, 2024

Daily Market Price Updates and Commentary 9th February 2024

Undeterred by recent failures to sustain above 24c the market was inst...

A graphic of two white human silhouettes overlapping, with a speech bubble containing a blue question mark above them, set against a blue circular background on a dark blue field.
  • February 9, 2024

Ask the Analyst: How bad has Weather been for CS Brazil Sugarcane?

Insight Focus Cumulative rains from December to January have been the ...
A digital display of stock market data with multiple blue line graphs, bar charts, and numerical values, representing financial trends and fluctuations on a dark background.
  • February 8, 2024

Daily Market Price Updates and Commentary 8th February 2024

Having failed to sustain above 24c the market started today’s se...
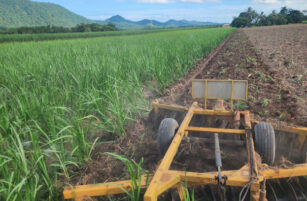
A yellow tractor plows a green sugarcane field under a partly cloudy sky, with mountains and lush trees visible in the background.
  • February 8, 2024

Farmer Diaries (Australia): Perfect Cane Growing Weather

Insight Focus This month has been spent inspecting and repairing the d...

A pixelated map of India on a teal background with circular eco-friendly icons, such as a tree, house, car, and leaves, connected in an arc with glowing light effects.
  • February 8, 2024

India: Sugar vs Ethanol?

Insight Focus Sugar exports are currently prohibited. At today’s...

Download the app

For global insights, logistics, reporting and much more…