
Archive

Digital financial chart showing fluctuating stock market data, line graphs, bars, and numerical values on a blue background. The image conveys dynamic market analysis and economic trends.
  • December 4, 2023

Daily Market Price Updates and Commentary 4th December 2023

Today marked another day of extreme volatility, continuing the trend o...

Close-up of an electronic stock market display with blurred city lights and bokeh in the background, showing illuminated blue and orange numbers and dots.
  • December 4, 2023

Sugar Futures and Market Data: 4th December 2023

Insight Focus Both the No.11 and No.5 sugar futures have weakened sign...
A well-lit refrigerator display in a convenience store, filled with assorted bottled and canned drinks, including water, soda, energy drinks, and juices arranged neatly on shelves.
  • December 4, 2023

Sugar Statshot: A Global Sugar Production Surplus in 2023/24?!

Insight Focus Drier weather in Central South Brazil extends sugar cane...

A digital screen displaying fluctuating financial graphs, stock market data, numbers, and bar charts on a dark blue background, representing financial analysis and market trends.
  • December 1, 2023

Daily Market Price Updates and Commentary 1st December 2023

A significantly higher call was being generated this morning as buy or...

A graphic of a white user icon with a question mark in a speech bubble, set against a blue circular background and a dark blue outer background.
  • December 1, 2023

Ask the Analyst: How Much Sugar Will India Divert To Ethanol?

Insight Focus India needs to divert more sugar to ethanol to meet its ...

A digital financial chart with fluctuating blue line graphs, bar charts, and numerical data overlays, representing stock market trends and financial analysis. The background is dark with glowing data points and grid lines.
  • November 30, 2023

Daily Market Price Updates and Commentary 30th September 2023

Having held robustly at 26.80 for the last four sessions there was an ...

An antique balance scale with a brass bowl of white powder on the left and a black weight on the right, set against a brown background. The scale appears slightly tilted, showing imbalance.
  • November 30, 2023

US Announces Third Raw Sugar TRQ Re-Allocation of 2023

Insight Focus  The US announces a third TRQ re-allocation of arou...

A digital display of financial data with line graphs, bar charts, numbers, and dates in blue tones, representing stock market trends and economic analysis.
  • November 29, 2023

Daily Market Price Updates and Commentary 29th November 2023

There was very little to get interested about this morning as a low vo...

A large red cargo ship with yellow cranes is docked at an industrial port, surrounded by warehouses and other moored ships, with mountains visible under a clear blue sky in the background.
  • November 29, 2023

3 Reasons Why CS Brazil Can’t Ship More Sugar This Season

Insight Focus Record sugar production in CS Brazil does not mean neces...
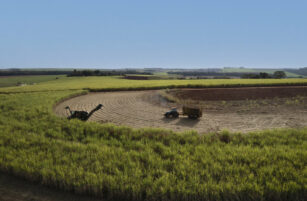
Aerial view of a sugarcane field being harvested, with machinery and a truck collecting crops in the middle of the field under a clear blue sky.
  • November 29, 2023

Why Will CS Brazil Make a Record Amount of Sugar This Season?

Insight Focus CS Brazil is set to produce a record 41.5mmt of sugar th...

Close-up of four fuel pump nozzles at a gas station, with two yellow handles and two green handles, positioned in a row against a blurred background.
  • November 29, 2023

CS Brazil: Sugar or Ethanol? 29th November 2023

This report is updated weekly, for daily information refer to our Inte...

A digital chart showing fluctuating candlestick and line graphs on a dark background, representing stock market or financial data analysis.
  • November 29, 2023

The Raw Sugar Futures July-October Spread

Welcome to the sixth instalment of Czapp’s course on futures mar...

Download the app

For global insights, logistics, reporting and much more…