Archive

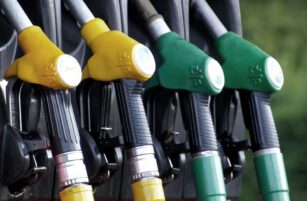
Several fuel pump nozzles at a gas station, with two black, one yellow, and two green handles arranged in a row, ready for fueling vehicles.
  • November 22, 2023

CS Brazil: Sugar or Ethanol? 22nd November 2023

This report is updated weekly, for daily information refer to our Inte...
Digital stock market chart with blue candlestick graphs, line charts, and bar graphs displaying fluctuating data and financial figures on a dark blue background, representing market analysis and trends.
  • November 21, 2023

Daily Market Price Updates and Commentary 21st November 2023

Having finally shaken away from the teens with yesterday’s rally...
A digital financial chart showing fluctuating stock prices, numerical data, and bar graphs against a dark blue background, representing market analysis and stock trading activities.
  • November 20, 2023

Daily Market Price Updates and Commentary 20th November 2023

The day began slowly with the market continuing the pattern set last w...

Close-up of an electronic display showing blurred numbers and blue lights, with city lights and orange bokeh in the background, creating an abstract and vibrant urban scene.
  • November 20, 2023

Sugar Futures and Market Data: 20th November 2023

Insight Focus The index long position in raw sugar has fallen to the l...
A digital screen displays financial data with fluctuating line graphs, bar charts, and numerical values, representing stock market trends and economic analysis. The image uses a blue color scheme.
  • November 17, 2023

Daily Market Price Updates and Commentary 17th November 2023

It was a very slow start to todays session with March’24 largely...
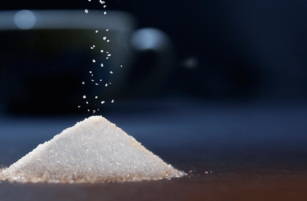
A close-up image of granulated sugar being poured into a small pile, with individual grains visible in midair against a dark, blurred background.
  • November 17, 2023

A Closer Look at Sugar Demand Destruction

Insight Focus Sugar prices have been high for all of 2023. We are yet ...

An icon of two white user silhouettes on a blue circle with a speech bubble containing a question mark, all set against a dark blue background.
  • November 17, 2023

Ask The Analyst: Why Did the Thai Domestic Sugar Price Increase?

Insight Focus The price of domestic sugar increased by THB 4/kilogram....
A digital financial chart showing fluctuating stock prices, line graphs, numerical data, and bar graphs, illustrating market trends and analysis on a blue background.
  • November 16, 2023

Daily Market Price Updates and Commentary 16th November 2023

There was immediate pressure applied to No.11 with March’24 push...

A dotted outline map of India is shown on a green background, with glowing eco-themed icons such as a tree, house, car, factory, and leaf connected in a circular pattern near the center.
  • November 16, 2023

India: Sugar vs Ethanol? 16th November 2023

Insight Focus Domestic sugar prices in Maharashtra have strengthened i...
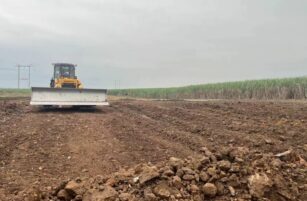
A yellow bulldozer levels a dirt road under a cloudy sky, with green fields and power lines visible in the background.
  • November 16, 2023

Farmer Diaries (China): What a Difference a Year Makes

What have you been up to lately? We are entering the season when rice ...
A close-up view of a digital financial chart showing candlestick patterns, colorful lines, and data points on a dark background, representing stock market or cryptocurrency trading activity.
  • November 16, 2023

The Raw Sugar Futures May-July Spread

Welcome to the fifth instalment of Czapp’s course on futures mar...

A person holding a freshly harvested sugar beet in their hands, with green leaves attached, standing in a field of green crops under bright sunlight.
  • November 16, 2023

WASDE Beet Projections Reach Record High

This update is from Sosland Publishing Co.’s weekly Sweetener Re...

Download the app

For global insights, logistics, reporting and much more…