Welcome to the second instalment of Czapp’s course on futures market spreads. In the previous explainer we looked at what a spread is and why they are relevant to market participants and analysts.
In this explainer we will look at what the key drivers of futures market spreads.
In upcoming explainers we will look what factors in particular drive the No.11 raw sugar futures spreads.
What Drives the Spreads?
Futures spreads can encourage buyers and sellers to adjust their shipment dates to access the best price and help smooth out the surpluses and deficits in the physical market.
Calendar spreads are influenced by a variety of factors, both fundamental (driven by the supply and demand of the underlying commodity), and technical (factors relating to trading the market). Outside factors, such as the wider macroeconomy, can also play a role.
As a rough rule of thumb, when contracts have plenty of liquidity spreads will generally react more to the true fundamental picture of the underlying commodity than anything else.
Liquidity gets worse the further a contract is from expiry as there is greater uncertainty over whether a contract is well priced, therefore the supply and demand picture tends to be more influential on the nearby contracts.
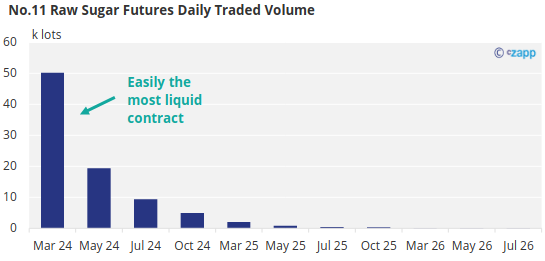
The below shows the clear drop-off in liquidity (daily traded volume) for later-dated No.11 raw sugar futures contracts for one example trading day. Some may even go untraded some days.
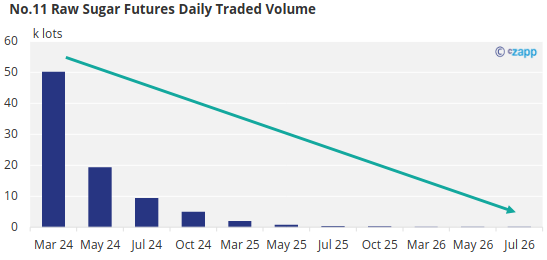
This means that the lower the daily traded volume on a contract, the more likely that the timing of the orders will be more influential than the fundamentals as the order flow can be more unbalanced.
The next explainers in this series will explain in detail how each of these factors affects the raw sugar futures spreads.
Let’s look first at how the supply and demand situation of the underlying commodity can be influential.
Supply and Demand
Seasonality
For agricultural commodities, crops are grown at different times of year depending on the climate. The peak of the northern hemisphere growing season will not align with the peak of the southern hemisphere growing season for example.
This means that every year during certain periods the world market will face higher supply than at other points.
The same is true on the on the demand side, religious holidays and festivals across the world, along with different dietary habits in different parts of the year (more ice cream in summer) mean that buying patterns can be seasonal too.
This means that for a given commodity it is not unusual to see certain spread pairs behave differently to other spread pairs depending on where in the year they fall.
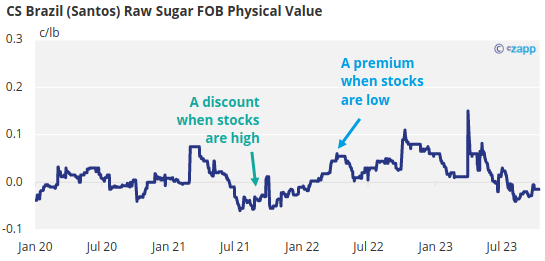
For raw sugar futures it is common for the October-March spread to trade at a discount (the October contract being cheaper than the March contract).
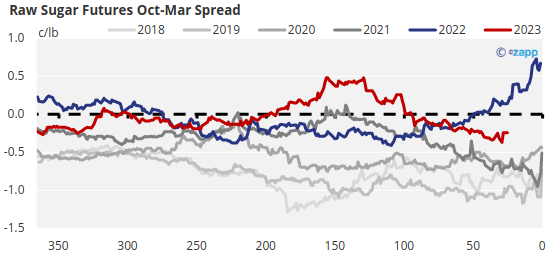
In October, stocks in the world’s largest exporter, Centre-South (CS) Brazil, are at their highest level, this means their ability to supply to the world market is at its peak at this time of year (in theory).
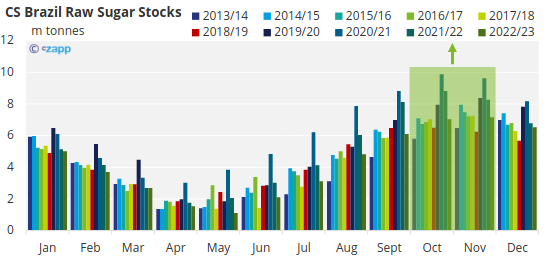
High supply has a downwards effect on the price of the October contract.
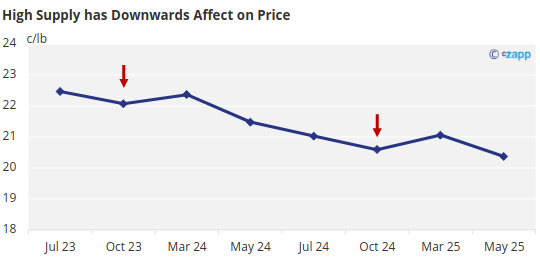
Whereas by March, CS Brazil is in its off crop, their stocks of sugar are at a low.
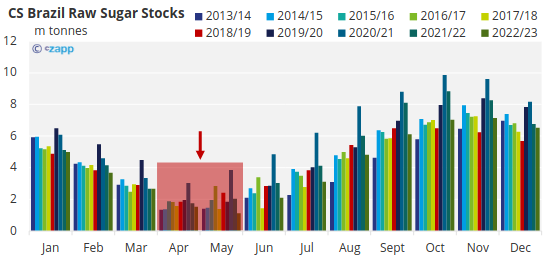
This means relatively speaking supply at this point in the year is lower, this has an upwards effect on the price of the March raw sugar contract.
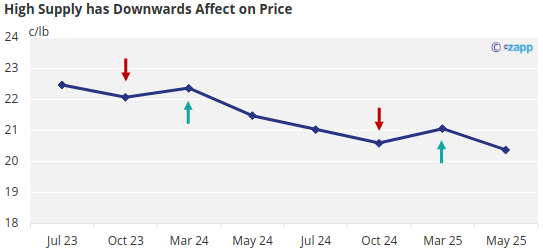
This supply mismatch means that the October contract must be cheap enough relative to the March contract that producers are encouraged to buy back their hedges in the October, to sell in the March (buy cheap, sell expensive). As such this spread usually trades at a discount.
For further explanation please see the next explainer in this series.
Cost of Carry
The logical follow-on question from the above is ‘how much will it cost to store the commodity for these extra months?’.
Holding on to stock is not free, it will need to be financed, warehoused and insured for example, and so by delaying moving the goods until further into the future these costs will need to be paid for longer.
This is called the ‘cost of carry’, how much it costs the seller to delay moving and ‘carry’ stock until the next delivery window.
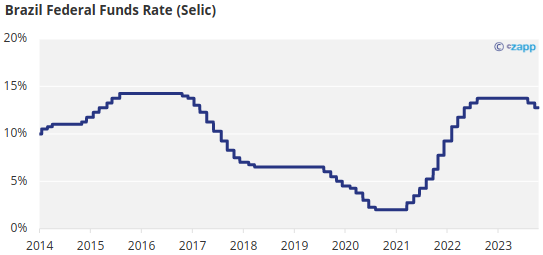
Interest rates in particular are a key part of this cost. For example, sugar mills in Centre-South Brazil will be very aware of and monitor the Brazilian federal funds rate (Selic). Positive moves in the interest rate in a country will increase the costs of finance and therefore the cost of holding stock.
Knowing the cost of carry is important since even if a spread is trading at a discount which should encourage the seller to delay shipment until the later contract, if the discount is less than the cost of carry, selling against the nearer-dated contract would still yield the better return for the seller.
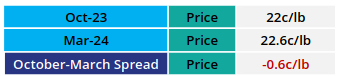
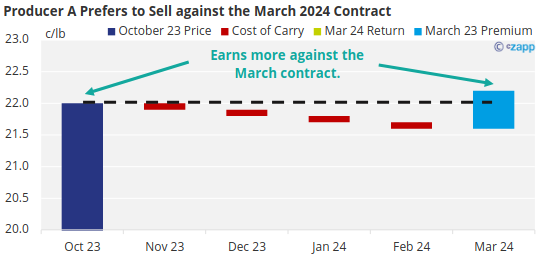
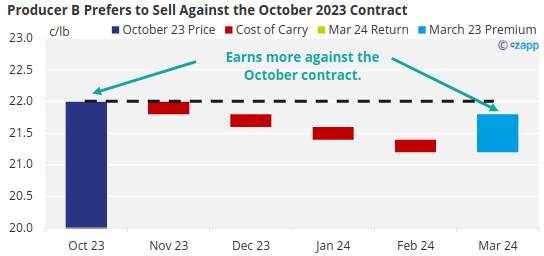
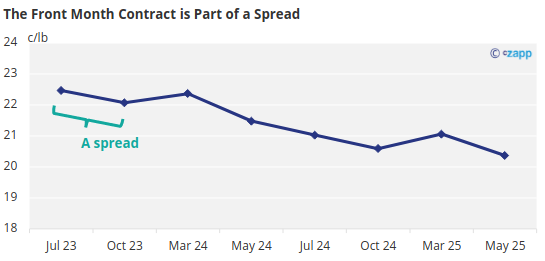
For example, let’s say a producer of raw sugar (Producer A) was deciding whether to sell their sugar against the October 2023 futures contract which is currently trading at 22c/lb, or the proceeding March 2024 futures contract, which is trading at 22.6c/lb.
The March 2024 contract does appear to offer greater value for the seller on the surface, however the stock will need to be carried a number of extra months if the seller decides to sell in March 2024. It costs Producer A 0.1c/lb per month to store their sugar these extra months.
Therefore, storing this sugar for four extra months will cost 0.4c/lb, whilst the March 2024 contract offers 0.6c/lb above the October 2023 contact. It is clear that carrying the stock is worthwhile in this instance as the seller will earn an extra 0.2c/lb by selling against the March contract.
It is important to note however that the cost of carry is different for every producer, even those within the same country, as such it needs to be understood which exporters are relevant to the delivery period in question.
Another seller (Producer B) who faces the same decision instead faces a 0.2c/lb per month cost of carry as they are unable to access financing at quite such a low rate compared to the first.
Producer B, after accounting for carrying stock would only earn 21.8c/lb by selling against the March 2024 contract, 0.2c/lb less than if they sold against the October 2023 contract. This seller would prefer to not carry the stock.
If the world market really needed more sugar to become available in early 2024 the October-March spread would need to extend further into discount to encourage sellers with a higher cost of carry to prefer to sell their sugar against the March contract.
Should the October-March spread extend from 0.6c/lb to 1c/lb, this would be enough to encourage Producer B to change their decision and sell against the March 2024 contract.
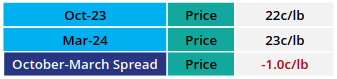
Now Producer B would be 0.2c/lb better off by selling against the March 2024 contract instead.
Used in conjunction with the fundamental supply and demand picture, understanding the cost of carry of the relevant exporters is key to predicting whether the spreads are trading at a fair value to encourage the exporters to delay their shipments or whether the spreads will need to weaken further to allow for the stock to be carried.
What if most spreads are trading at a discount?
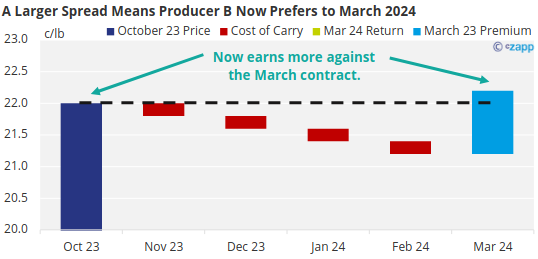
The Shape of the Forward Curve As is covered in the first explainer in this series, a sequence of consecutive spreads linked together is called a forward curve. If many of these spreads are trading at a discount the curve would appear upwards sloping (in contango).
This would happen if there is a structural oversupply of the commodity and is often called a ‘carry market’ since it encourages sellers to carry their stock as far into the future as they are able (provided each spread is above the cost of carry).
It will also encourage buyers to bring forward demand from the future to now to access a better price then hold on to it until it is needed (provided the spread is better than the cost of carry).
The reverse scenario, where most spreads are trading at a premium, the forward curve would appear downwards sloping, and the market would be considered ‘backwardated’.
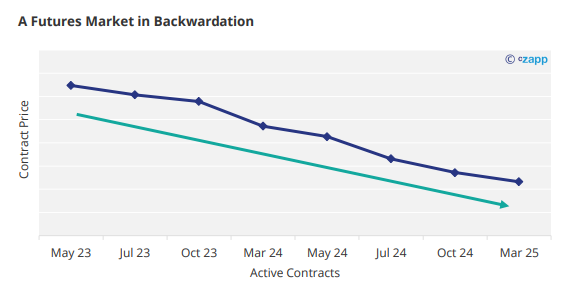
This would occur when there is a structural shortage of the commodity and will help encourage sellers to bring forward any future supply to the near term and encourage buyers to capture a price by deferring their demand until as late into the future as they can.
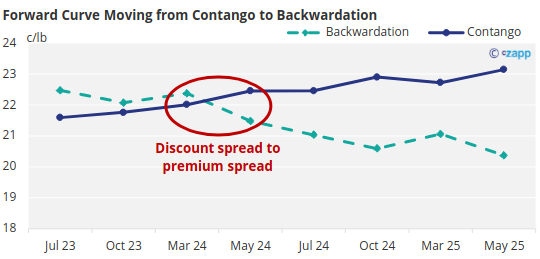
If a forward curve looks to be shifting from contango to backwardation (upwards sloping to downwards sloping), buying a discount spread (buy the nearby futures & sell the far month futures) might therefore be worthwhile, since the far-month contract might decrease in price relative to the nearby contract
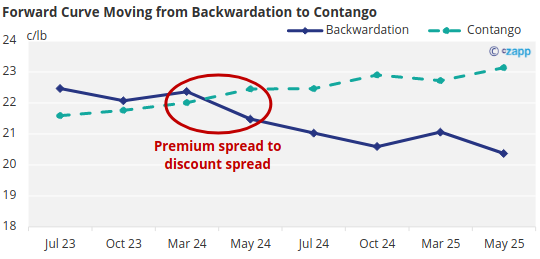
If it shifts from backwardation to contango, selling the spread might benefit.
Even under more normal circumstances where there isn’t a consistent trend amongst the spreads it is logical that the state of one spread pair is influential on the state of neighbouring spread pairs since each futures contract is both the early-dated in one spread, and the later-dated in another.
Let’s say there is a negative supply shock (less supply) affecting the market around September-November. The nearest relevant futures contract is the October 2023 contract which would then face upwards pressure as supply becomes scarcer at that point in the year.
If the shock is large enough it could move the Jul-Oct spread from a premium to a discount, but also the Oct-Mar spread from a discount to a premium.
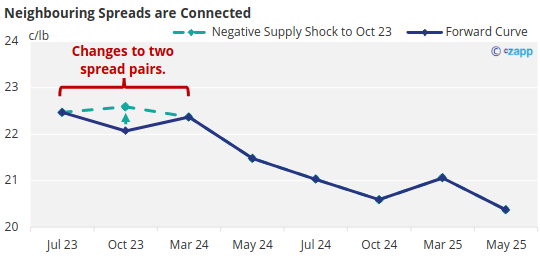
As such, the timings of supply availability that weigh on one spread pair must also weigh on the neighbouring spreads.
This means that one supply or demand event can ripple throughout a forward curve.
Physical Values
A physical premium is a factor added to a world market benchmark price to better account for the supply and demand situation in different regions. In other words, physical values turn a ‘one size fits all’ world market price to one that better fits the region of the world it is relevant to.
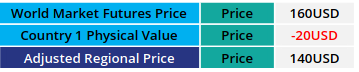
For example, let’s say the current world market futures price of ‘Commodity X’ is 160USD/tonne, this is the global benchmark price.
Country 1 is the largest exporter of Commodity X and commonly holds high stocks of it. Given the relative abundance of this commodity in Country 1 then the world market price might be too expensive for buyers in this region. Since buyers have plenty of alternative supply to choose from, sellers will need to discount their price to make sales.
Let’s say that most buyers are currently willing to accept Commodity X from sellers in Country 1 at a 20USD/tonne discount to the world market price, this is the Country 1’s physical value for nearby delivery.
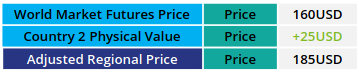
Let’s look instead at Country 2. Country 2 is also an exporter of Commodity X but is geographically in a part of the world where there is scarcity of this commodity.
In this region most buyers are then currently willing to pay over and above the world market price to ensure they can access supply from Country 2 given there is little alternative. Let’s say sellers won’t sell for less than 25USD/tonne above the world market price, this is therefore the physical value of Country 2.
With the inclusion of physical values it is now clearer where in the world supply is, and where it is needed.
Physical values change regularly over the course of a season to reflect the relative availability in the part of the world they are relevant to and can act on spreads in a similar way to the cost of carry outlined earlier:
Market participants will be aware of the physical values of different countries at different stages in the future and so spreads can often need to strengthen/weaken to offer sellers more/less than the physical value to encourage supply to be advanced or deferred to points in time when it is more needed.
Factors That Particularly Affect the Front Spread
It is worth now making the distinction for factors that are insightful for predicting the future direction of the flat price of a commodity.
The below are still worth covering however since the front month contract (flat price) is part of a spread with next nearest contract to expiry.
Speculative Involvement
Speculators are defined as those wishing to profit from a change of the price of the commodity without being involved in physically in the underlying.
They can have great influence on the flat price, sometimes in reaction to news stories about the fundamental picture of the underlying commodity, and sometimes to capitalise on momentum in price movements.
Generally, speculators tend to be most involved in the front month contract. This is because the front month contract tends to be the most liquid (at least until it is close to its expiry). High liquidity allows trades to be opened and closed closest to the speculators desired price.
The front month contract is also most sensitive to the wider macroeconomic environment such as oil prices, the strength if the US dollar, and interest rates. Shocks to any of these external factors can often be triggers for speculators to extend or withdraw from the commodity futures market.
If speculators hold a large, long position on nearby futures contracts, this implies that nearby futures contracts have rallied more than the price of distant futures contracts.
Expiries
As an extension to the above, whilst the futures market and the physical market are generally closely linked, for most of the time the futures market could be trading at a premium or deficit to the physical market.
However, in the lead up to a contract expiry all those with open positions need to make sure they are well positioned to either deliver/receive the commodity through the expiry (if the futures contract is physically settled), or close out of their positions if they do not wish to be involved in the expiry.
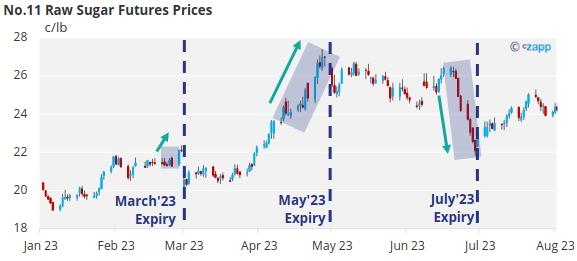
Since the expiry involves the physical transfer of the commodity it forces the futures market to briefly align with physical market. This can lead to the flat price quickly rallying or falling away in the weeks leading up to it.
Below is the price chart for No.11 raw sugar futures in 2023, highlighting the first three contract expiries. Before each one the price sharply rallied or fell away.
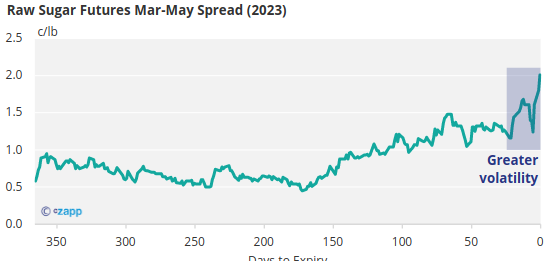
This means that the front month spread can also become distorted. Here is the March-May 2023 spread, look at how high the volatility over the last 25 days before the March’23 expiry is compared to earlier on.
Fund Rolls
For those not looking to participate in a futures contract expiry but want to hold on to their positions they must be rolled to the next contract before the current one expires. Many funds will do this during a set period of time before the contract expires, this is called the fund roll.
For example many index funds trading the No.11 raw sugar futures market choose to roll their position on to the next contract between the 5th and 9th business day of the month preceding the contract expiring.
For others there is not a specified window to adhere to but generally the roll will occur during a similar window, any later and liquidity in that contract falls too low, leaving participants open to increased volatility.
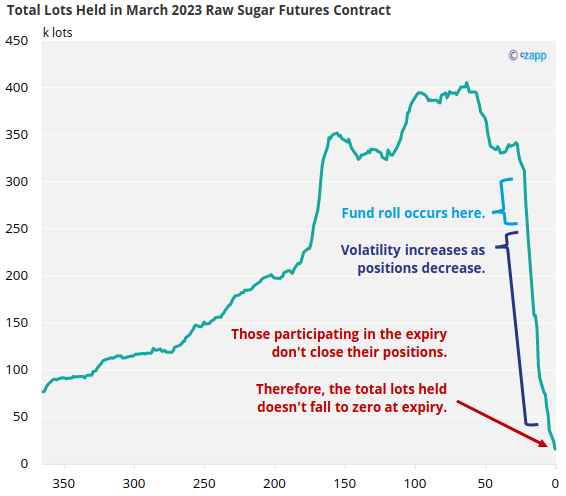
This can manifest in a fairly large amount of buying/selling pressure on the contract soon to expire, and a fairly large amount of selling/buying pressure on the next contract, exacerbating the spread between the two.
If you have any questions, please get in touch with us at Jack@czapp.com.