
Insight Focus
- We have used machine learning to research commodity market structure.
- Our algorithm has uncovered relationships between commodities.
- There is a strong relationship between sugar and cocoa, and an inverse relationship between sugar and dairy.
Using Machine Learning in Commodities
Analysing relationships between different markets is hard. Knowledge about market structure is often retained in the minds of experts with long tenures in the industry. We’ve used machine learning to help understand some of these relationships.
When examining the relationships between different commodities, people tend to look at relative returns or prices. This is effective but may not always capture deeper relationships between commodities. These relationships are also often obscured by short-term noise or fluctuations in the data.
To get around this, we’ve concentrated on correlations between price trends, using a dynamic trend detection algorithm that identifies the most significant trend within a 2-week to 6-month window. We then identified groups of commodities that trend together using clustering, a machine learning process that finds groups in a data set.
Uncovering Relationships Between Commodity Markets
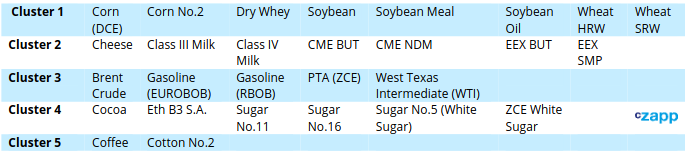
Our algorithm identified the following clusters of commodities:
- Cluster 1: Grains
- Cluster 2: Dairy
- Cluster 3: Oil and energy
- Cluster 4: Sugar
- Cluster 5: Cotton and coffee
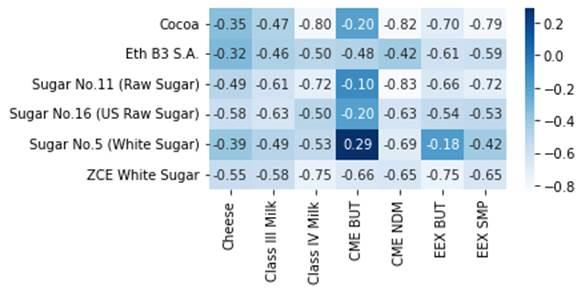
The clusters can be observed in this heatmap where each value corresponds to the rounded correlation coefficient and the colour indicates the magnitude of correlation – the darker the entry in the table the higher the correlation.
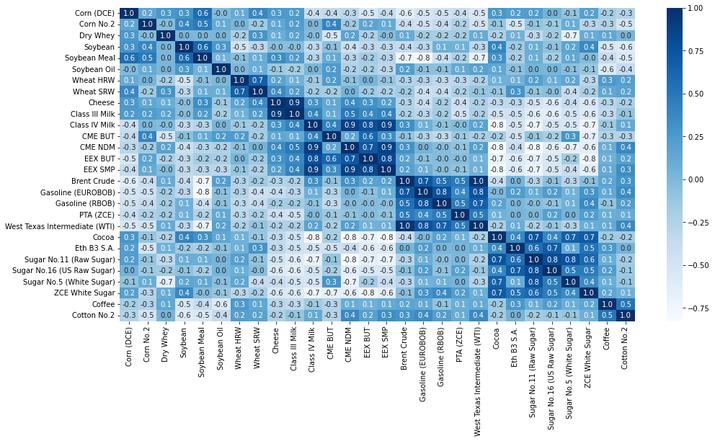
At first glance the algorithm seems to have segmented commodities logically. Commodities with clear fundamental relationships, such as Class III Milk and Cheese have high correlations.

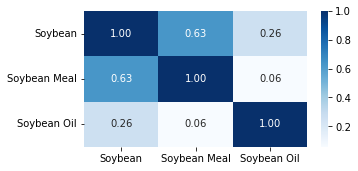
The algorithm also shows the magnitude of the relationships. Zooming in on soybeans, we can see that soybeans and soymeal are reasonable analogues but soybean oil has only a weak relationship with both.
Intriguing Relationships – The Chocolate Spread and The Dairy-Sugar Connection?
There are several less-obvious relationships in the data.
For example, the correlation between raw sugar and cocoa appears to be almost as significant as the correlation between raw sugar and white sugar (and even stronger than the relationship with ethanol). Perhaps in addition to the white premium, we should also pay attention to the cocoa-sugar (chocolate?!) spread?
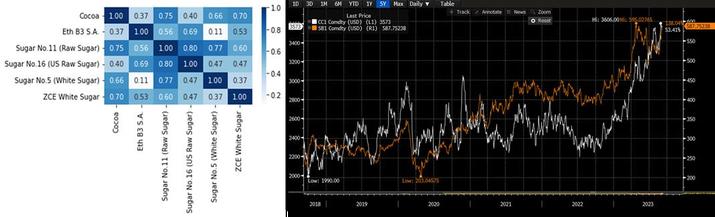
Source: Bloomberg
We can also pay attention to negative relationships. Our analysis shows that sugar and dairy are highly inversely correlated. Perhaps if sugar prices rise then food manufacturers may increase creaminess (using more Class IV Milk products) while decreasing sweetness to manage costs?
Beyond Correlation
In our next article, we will build on this technique to examine in more detail how the Russian invasion of Ukraine has affected commodity markets.