Navigating the complex world of futures trading can be a daunting task, but with the right strategies, investors can unlock significant opportunities. This article will explore how to identify and capitalize on price discrepancies in the futures market, leveraging curve structure analysis and calendar spreads to enhance hedging and exploit mispricing.
Happy New Year to you all! As we flip over a new calendar, I thought to myself: what better time to write a piece on Calendar Spreads?
What is a Calendar Spread Trade?
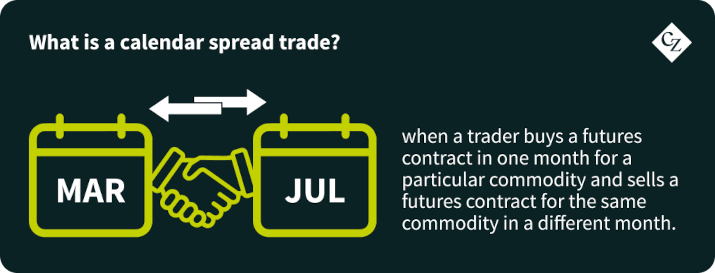
- For example, a trader might buy 50 lots of March 2024 whole milk powder (WMP) futures on the SGX-NZX and sell 50 lots of July 2024 WMP futures simultaneously.
- Sometimes two futures contracts on the same commodity futures curve can trade at materially different prices. This might not make sense; a Calendar Spread trade could yield a profit.
- For example, skimmed milk powder (SMP) might be trading at $2,000 USD/MT in the near months and $4,000 USD/MT in the deferred.
- If this opportunity were present, a trader wo uld seek to profit from this by buying the cheaper nearby price and simultaneously selling the more expensive deferred price.
Conceptualizing a Calendar Spread Trade:
- A calendar spread is similar to a Cross-Commodity spread. While cross-commodity spreads look at the price difference of two different (but alike) commodities at the same point in time, calendar spreads instead focus on the price difference of the same commodity at different points in time.
- For calendar spreads you then only need to focus on one futures curve. However, there are two important factors which must both be considered: the curve structure and the seasonality of the commodity.
Curve Structure:
- Curve structure is essentially the steepness of the futures curve. It is easiest to just look at pairs of futures contracts in isolation for this analysis.
- I tend to take the historical daily price data for the rolling futures contracts.
- I then construct a series of the difference between each pair of rolling futures contracts. This means a lot of series! For example, if looking at just twelve monthly futures I will have 66 unique series of pairs.
- Like the analysis for cross-commodities, I then look at the statistical distribution of these pairs. Trading opportunities will appear in the wings, or extremes of the statistical distribution.
- I then determine some percentiles which I would be confident that a particular pair of contracts has diverged enough for there to be a trading opportunity, i.e. an “entry trigger”. Prior to entering any trade it’s also important to predetermine an “exit trigger” which should be at a level where pricing has converged enough to be considered at a normal level. It’s also important to establish a “stop-loss trigger” where losses are cut because the spread has continued to diverge and may have “broken down” at this point in time.
- For calendar spreads you essentially want to buy the near contract and sell the deferred if the curve is statistically “too steep” and sell the near contract and buy the deferred if the curve is statistically “too flat” (which is likely to mean “too backwardated” in most cases). It is best to assume that the triggers are symmetrical in terms of their point on the statistical distribution, unless you are confident that the price data of the commodity pairs exhibits a significant skew.
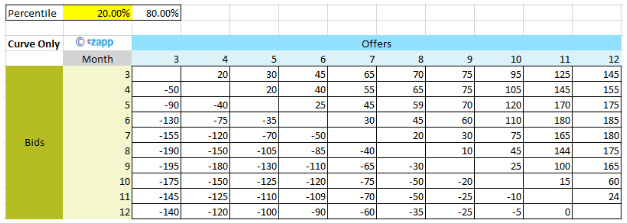
- Let’s say that you have selected the 20th and 80th percentiles as your triggers. The easiest way to then see what these translate to in terms of price differences between your various pairs is using a matrix. For example, where in the below the numbers are the front contract minus the back, so a positive value for a pair indicates a curve in backwardation (downward sloping):
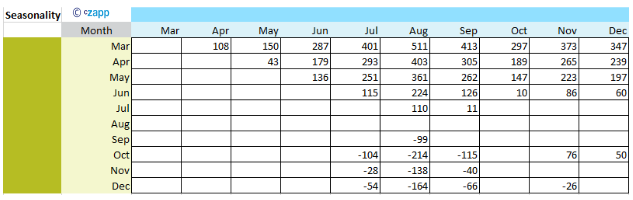
Seasonality:
- Agricultural commodities often exhibit seasonality. For dairy the major seasonal factors are milk production seasonality (driven by the lactation cycle of dairy cows and weather conditions), feed availability and cost, consumer demand (which can vary in different regions), and Government policies (like annual tariff free quotas).
- It is important to overlay your understanding of seasonality with your statistical analysis of the futures curve structure and adjust your triggers accordingly. This is especially true when you are analyzing rolling commodity futures price data which averages out all seasonal effects.
- Seasonality is relatively easy to calculate, I tend to just use the final settlement price data for a given commodity and average the final settlement price for a given month across the years.
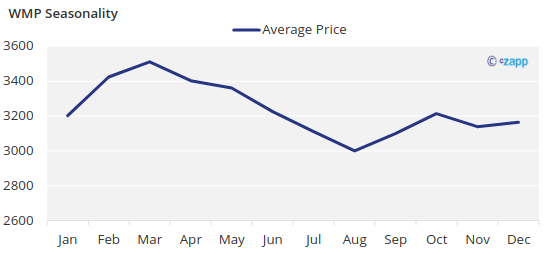
- To aid your analysis it is best to then convert this chart into a matrix like the below. Again, a positive number for seasonality indicates that the monthly pairs on average settle in what would be a backwardated futures curve and vice versa. Given that seasonality only exists one way, your matrix should only show one result for each pair depending on their seasonal relationship:
Combining your analysis of Curve Structure and Seasonality to structure a typical Calendar Spread Trade:
- Time to piece it all together!
- You now want to take the more extreme value (high or low) out of the curve structure at your trigger points or of the seasonality between your monthly pairs.
- Crucial here is to ensure that you are comparing like-for-like, remember that one analysis looks at rolling contract periods while the other looks at months. Ensure that the contract periods line up with the correct months when you combine.

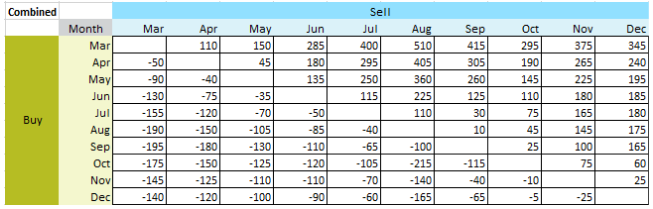
- Let’s zoom in on August vs. September here and see what this is telling us:
- a) Curve structure at the 20th and 80th percentiles says to buy August/sell September if September is $30 USD/MT above August and to sell August/buy September if August is $10 USD/MT above September.
- b) Seasonality says that August settles on average $99 USD/MT below September.
- c) Combining the above means that a trader’s spread orders would be to buy August/sell September if September is $100 USD/MT above August and to sell August/buy September if August is $10 USD/MT above September.
- d) The seasonality overlay here is crucial to reduce the risk of buying futures in a month in which prices are seasonally weaker.
- If you are now confident that the spread you have observed in prices at present has statistically diverged from its typical differential, that the slope of the curve aligns with observed seasonality and you have a time horizon and triggers to enter and exit the trade at levels where you believe that you are likely to profit, then you are ready to put a trade on.
Applying these analytical methods, let’s consider a practical scenario to illustrate potential benefits of Calendar Spread trades against a physical position:
- Aside from outright profit seeking from a perceived mispricing, physical market participants can use this style of trade in an effort to add value to hedge positions.
- For example, let’s say a manufacturer who uses SMP as an ingredient has a three year indexed Supply Agreement linked to GDT. GDT SMP can be hedged using SGX-NZX SMP futures, so if the manufacturer saw value in the futures market in October they could lock this in using the SGX-NZX. However, the November futures contract might be trading at a statistically significant discount to October for the commodity which the manufacturer wants to hedge. The manufacturer could then buy November futures instead of October futures. In doing this, they have given themselves a degree of price certainty for their commodity (both contracts will be influenced by movements in the underlying commodity directly) plus also the opportunity to profit from the perceived mispricing. The manufacturer has entered into a basis hedge which is likely to enable them to receive physical product at a discount (for those months which the basis hedge is on for).
- In the above case, the manufacturer only needs to enter the long November trade because they are already short October through the physical indexed Supply Agreement.
A worked example of using a Calendar Spread Trade to hedge (“Basis Hedge”):
- Let’s say a manufacturer has an indexed Supply Agreement with index “average GDT SMP MH C2 in the month two months prior to shipment + $100 USD/MT”.
- The manufacturer wants to lock in their FOB pricing for shipments in Dec-24. They can do this by buying the Oct-24 SGX-NZX futures for $3,130 USD/MT, thus locking in their FOB pricing for $3,230 USD/MT.
- Alternatively, they could use the Sep-24 or Nov-24 futures, which are also for objectively very similar timing.
- Their analysts realise that at present the Nov-24 contract, which is trading at $3,040 USD/MT, is statistically undervalued vs Oct-24 and more so than the typical seasonality suggests.
- The recommendation is that Nov-24 should be considered as a basis hedge for the Oct-24 exposure. The analysis shows that there is likely to be $90 USD/MT of benefit in using the basis hedge and have decided that they are comfortable with 10 months being long enough for the calendar spread to correct.
- The recommendation is approved. The manufacturer has their supply chain manager execute the hedge using SGX-NZX and locks in the pricing for their Dec-24 shipment.
- In March 2024 the calendar spread has converged by $80 USD/MT. The manufacturer is happy to now switch their hedge over to a perfect hedge. They exit the Nov-24 position and replace it with an Oct-24 position.
- The cost of having had the basis hedge on is $10 USD/MT more expensive than it would have been to just enter a perfect hedge to begin with.
- All told, the manufacturer has netted a $70 USD/MT trading profit from the basis hedge and has essentially reduced the adder on their indexed Supply Agreement from $100 to $30 USD/MT which is significantly more competitive than their baseline.
- By replacing the basis hedge with a perfect hedge before their shipments, they were able to lock in a fixed price of $3,160 USD/MT FOB (vs. the $3,230 that they had considered to begin with).
Risks to be aware of when entering a Calendar Spread Trade
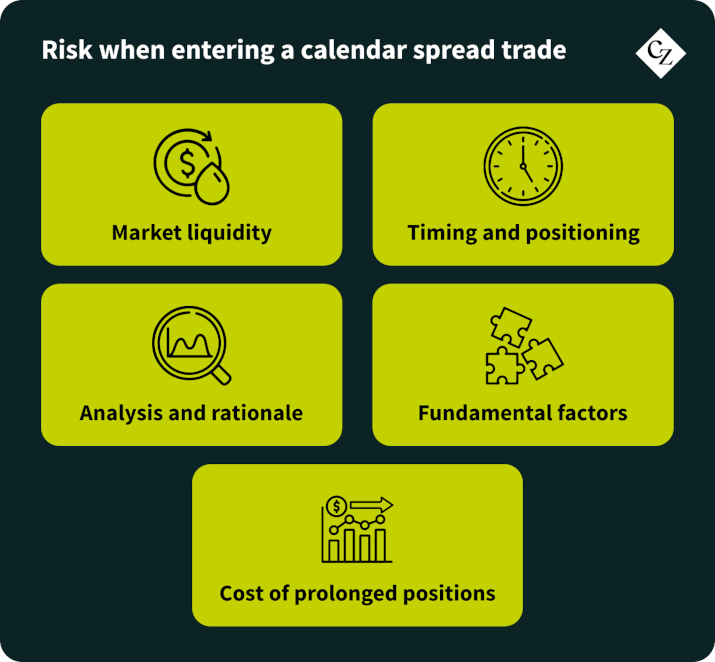
- Market Liquidity:
- a) Concern: One of the primary risks in calendar spread trading is related to market liquidity. Illiquid markets, especially in commodities like dairy, can pose challenges when entering or exiting positions.
- b) Consideration: Traders should assess the liquidity of the futures contracts they intend to trade, ensuring there’s sufficient trading volume to execute positions without significant price slippage.
- Timing and Positioning:
- a) Concern: Timing the entry and positioning of calendar spreads is crucial. Even if the analysis is correct, being right at the wrong time can lead to losses.
- b) Consideration: Traders should carefully evaluate the divergence from the normal curve slope, seeking spreads that balance profit potential and convergence expectations before contract expiration.
- Analysis and Rationale:
- a) Concern: Overconfidence in analysis can lead to overlooking critical factors or flaws in the trading model. Independent review and feedback are vital.
- b) Consideration: It’s prudent to seek feedback and assess trading models critically. Avoid being solely reliant on statistical analysis; consider fundamental factors impacting prices.
- Fundamental Factors:
- a) Concern: Ignoring underlying fundamental shifts impacting commodity prices may result in misinterpretation of spread discrepancies.
- b) Consideration: Continuously evaluate market fundamentals, such as supply-demand dynamics or geopolitical changes, alongside technical analysis.
- Cost of Prolonged Positions:
- a) Concern: When spreads remain open longer than anticipated, costs associated with maintaining positions can erode potential profits.
- b) Consideration: Traders should weigh the cost-benefit of rolling positions, managing margin accounts, and transaction expenses to avoid unexpected losses.
Conclusion – Key Takeaways:
As we conclude our exploration of calendar spreads for dairy futures, several crucial insights emerge:
- Understanding Calendar Spreads:
- a) Calendar spreads involve buying and selling futures contracts for the same commodity but with different delivery months.
- b) Exploiting price disparities between these contracts can offer profit opportunities.
- Analytical Foundation:
- a) Evaluating curve structure involves assessing price differences and statistical distributions.
- b) Overlaying seasonal influences onto this analysis helps gauge potential market movements.
- Practical Application:
- a) Calendar spreads aren’t solely about profit; they can enhance hedging strategies for market participants.
- b) Real-world scenarios showcase the nuanced yet impactful role of spreads in commodity trading.
- Risk Awareness is important, as with any trading strategy.
A Note on Calendar Spread Order Functionality:
- Given the popularity of calendar spread trading, many exchanges offer the ability to enter “spread orders”. Spread orders are entered as one number, that being the difference in the value of the two commodity contracts.
- Both CME and SGX-NZX offer this calendar spread order functionality along with implied order functionality, which means that an implied bid or offer based on a spread order will be shown on screen if it is better than the market facing bid or offer.
- Execution via spread orders removes “leg risk” which is the risk of entering only one side of a spread trade, as both legs are entered simultaneously.
- These spread orders are also useful when seeking to roll futures positions along the curve.
Want to bring the potential profit of this structure in-house but can’t do it alone? Call us!
- To construct a calendar hedge on your own you need:
- Access to the associated/appropriate derivatives markets.
- Access to physical product and approval to buy physical product linked to an index.
- The ability to fund potentially large values in your derivative margin accounts for several months.
- If you think that this kind of structure could benefit your business but don’t have all of the components in-house, then CZ can help facilitate this for you transparently.
- Get in touch with Tom at TSoutter@czarnikow.com