
The use of technical analysis in predicting stock trends can be complemented by machine learning tools, which are capable of identifying support and resistance levels. However, it is important for traders to also consider fundamental analysis and be cautious of false signals.
Fundamental analysis involves studying a company’s financial statements and macroeconomic factors to make predictions, while technical analysis focuses on historical market data patterns. Machine learning algorithms can process large volumes of data from various sources to identify patterns and make predictions more accurately and rapidly than traditional methods, thereby combining the benefits of both technical and fundamental analysis.
In this article, we are going to look at some basic technical indicators for dairy markets.
What is Technical Analysis – is it real?
- Definition of Technical Analysis: financial analysis that uses patterns in market data to identify trends and make predictions.
- Technical Analysis is often referred to as a tautology, that being “something that happens because it does”. Essentially because people study technical indicators and trade them, they may force these patterns to play out rather than the patterns “naturally existing”. The important thing to note is that these patterns are observed. Whether by market participants trading them into existence or not, the fact that they exist means that they should be considered useful.
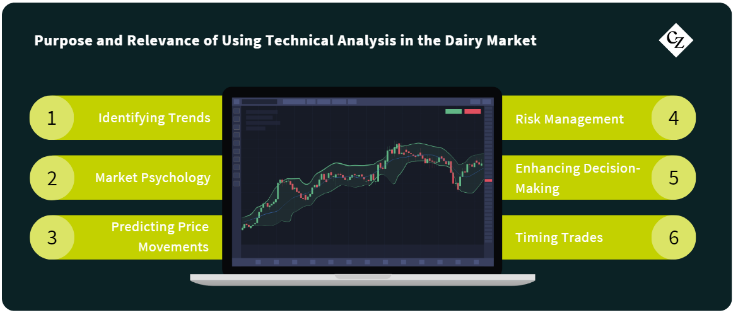
Purpose and Relevance of Using Technical Analysis in the Dairy Market:
- Identifying Trends: Technical analysis helps traders in any market to identify and understand price trends. By analyzing historical price data and chart patterns, they aim to spot trends and make informed decisions about buying or selling a commodity.
- Predicting Price Movements: Technical analysis can help market participants to make predictions about future price movements. By recognizing patterns and support/resistance levels, they can anticipate potential price changes and adjust their trading strategies accordingly.
- Risk Management: Technical analysis is a valuable tool for managing risk in the dairy market. Traders can use technical indicators to set stop-loss orders and determine entry and exit points, helping to minimize potential losses.
- Market Psychology: Technical analysis considers market psychology and sentiment, which can influence dairy prices. By analyzing market data and sentiment indicators, traders can gain insights into how other market participants perceive the market and react accordingly.
- Timing Trades: Technical analysis provides guidance on the timing of trades. Traders can use technical indicators to determine optimal entry and exit points, with an aim to increase the likelihood of profitable trades.
- Enhancing Decision-Making: market participants can use technical analysis as one of several tools to make well-informed decisions. By combining technical analysis with fundamental analysis and other information, you can have a more comprehensive view of the market.
Lines on Charts vs. Support and Resistance Levels:
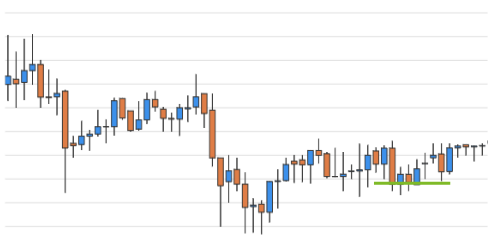
- Anyone can draw a line on a candlestick chart and say that it means something. A Technical analyst must have specific rules for how they set up their charts that do not change from market to market.
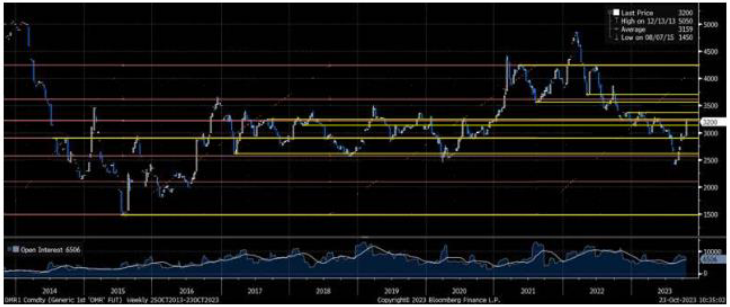
- I find that horizontal lines are much more trustworthy than angled lines. Even still, I will not add a new horizontal line to a chart unless a price point has been proven at least three times in a row by an opening or closing price. That being the top or bottom of the body of the candlesticks must line up three times in a row. For example, see the green line I have added to the chart below.
- For dairy charts, given the relatively lower liquidity, I would recommend using weekly candles.
- Once a line has been added it stays on the chart forever.
- Angled lines or channels are still useful. It is much easier to think that you have spotted the possibility of adding an angled line to a chart. For this reason, I make sure to have at least four open or closing prices lining up exactly to the angled line if I am adding one. Be strict in this practice.
Fibonacci Retracement Levels aka “Fibos”:
- The Fibonacci Sequence is the series of numbers: 0, 1, 1, 2, 3, 5, 8, 13, 21, 34, … The next number is found by adding up the two numbers before it.
- Fibonacci numbers are found throughout nature, for example spirals of seeds in the center of a sunflower. Therefore, many traders believe that these numbers also have relevance in financial markets.
- The Fibonacci retracement levels (“Fibos”) are all derived from this number string. After the sequence gets going, dividing one number by the next number yields 0.618, or 61.8%. Divide a number by the second number to its right, and the result is 0.382 or 38.2%.
- The Fibos used by Technical Analysts are 23.6%, 38.2%, 61.8%, and 78.6%. While not officially a Fibonacci ratio, 50% is also used. The percentage is how much of a prior move the price has retraced.
- Typically, a trader will determine low and high price points (0% and 100% respectively) and add the Fibos between them. These are added as horizontal lines to the chart and indicate where support and resistance are likely to occur. I like to use the method mentioned earlier to add all of my own horizontal lines to a chart first, then add the Fibos using the lowest and highest line I independently identified.
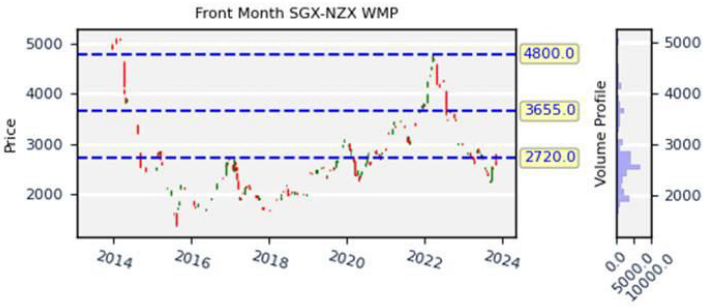
- Let’s use the past 10 years of weekly candles for the SGX-NZX WMP market as an example:
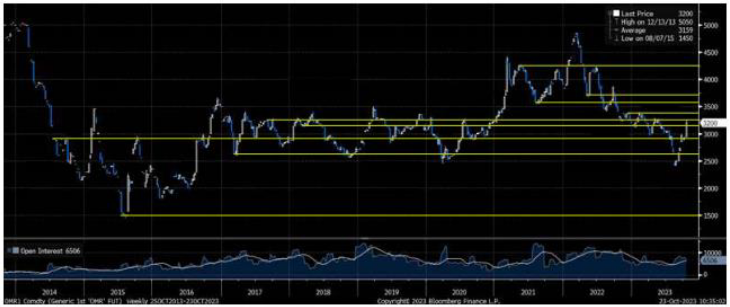
Now add your Fibos:
- You can see that six of the nine lines we have added match very closely to the Fibos (granted the top and bottom ones match intentionally).
- This chart was generated on 23/10/23 and at this point the market price was hitting the 61.8% Fibo level which was also an independent level put in by the market in in late 2017.
Moving Averages and Traded Volume:
- Simple moving averages (“SMA’s”) are an easy technical indicator to follow. I like to use the 21-week, 50-week and 200-week SMA’s.
- The shorter period moving average, in my case the 21-week, is often called the fast line. When this crosses through the slower lines from below it is considered a weak bullish indicator, likewise a cut from above is a weak bearish indicator.
- When the 50-week crosses the 200-week in the same direction as a cut made by the 21-week, it is seen to lend strength to a move.
- For example if the price were to trade down through the 50% Fibo, and shortly after the 50-week SMA crossed the 200-week from above, this would be considered a strong bearish move and technical analysts would be looking at the next price level down as a target.
- The MACD (Moving Average Convergence Divergence Indicator) is another commonly used moving average indicator, we will not go into detail in this piece.
- Traded volume following a sustained price move up or down is important to note. High volume or increasing volume with the price move will add strength to that move. Technical analysts would say that a move is “weak” if the traded volume alongside that significant move is low or declining.
Machine Learning Support and Resistance Levels:
- The CZ Quantitative Analysis team have constructed a machine learning support and resistance tool.
- It determines monthly support and resistance levels from rolling highs and lows using Agglomerative Clustering, which means finding the number of groups of prices that share common highs and lows to minimize an error metric.
- This combines the logic of the importance of horizontal lines and volume traded while removing the human analysis aspect.
- This tool is useful as it can perform a form of technical analysis quickly, across multiple markets and using a consistent method vs. the painstaking act of an individual adding their lines and to an individual chart in traditional technical analysis.
- You can see below the plot of this tool’s results on the SGX-NZX WMP chart; the two lower lines are at levels near the Fibos we had manually constructed:
Risks to be aware of when trading technicals:
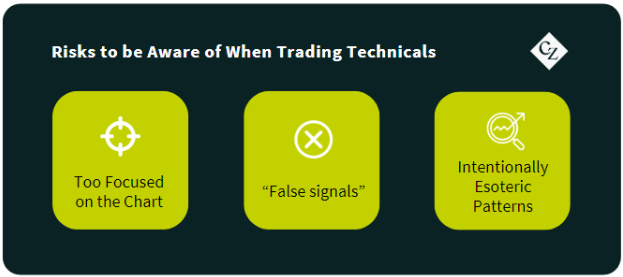
- Being too focused on the chart and not enough on the fundamentals. The price chart is simply the combination of all known factors in the market playing out over time. It is important to always follow what is happening in the real world that could be impacting the price of a commodity, even if you are running a technical strategy.
- Technical indicators can generate “false signals”, particularly in choppy or sideways markets. This can lead to losses if traders enter trades based on these signals. This risk is heightened in less liquid markets like dairy derivatives, as wider spreads mean that the implied cost of reversing a position due to a false signal can be significantly higher.
- Some analysts/traders use patterns which could be described as intentionally esoteric. It is important to ensure that you understand exactly what you should be looking for and are applying a particular pattern correctly to get the outcome sought.
- Get in touch with Tom at TSoutter@czarnikow.com.