Insight Focus
- 12 Year Highs in Raw Sugar Mean We’ve Been Asked to Look At the Last Major Rally.
- 2009/10 brought El Nino, Brazilian logistics problems and a buyer short squeeze.
- Sounds familiar….what can we learn that’s useful today?
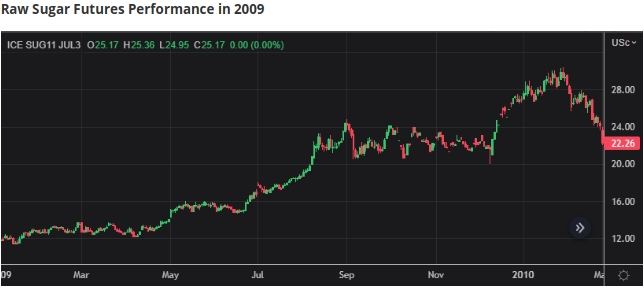
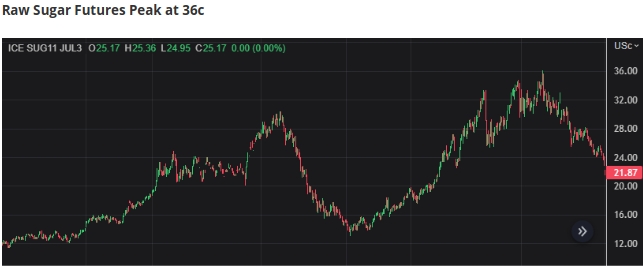
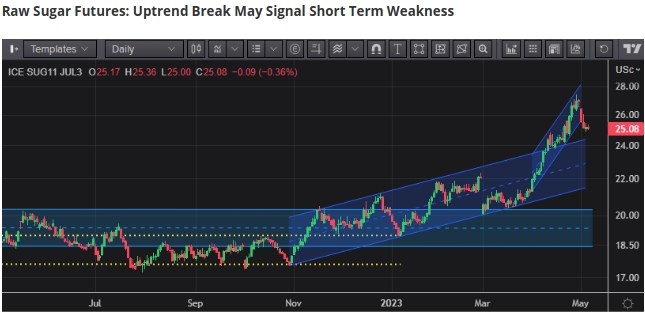
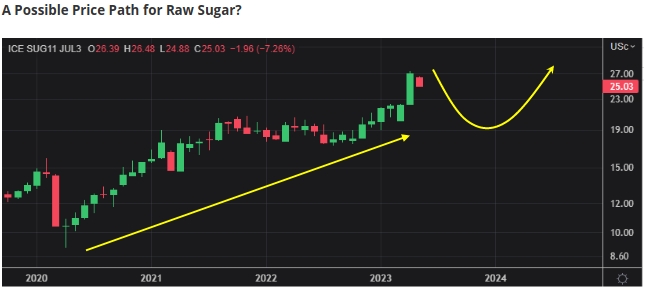
Raw sugar prices have recently rallied to 12-year highs near 27c/lb.
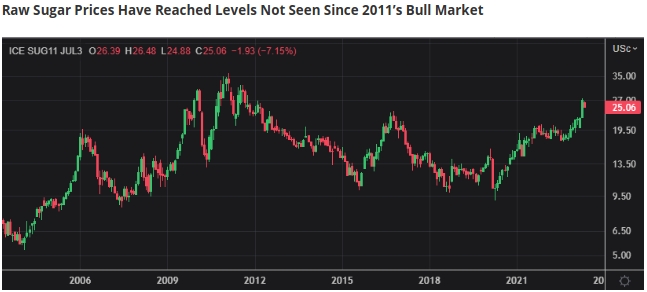
Source: Refinitiv Eikon
This has led to increased interest in the last major bull market of 2009-2011: what triggered it and what can we learn from it. Let’s take a closer look.
2009-10: Rally To 30c
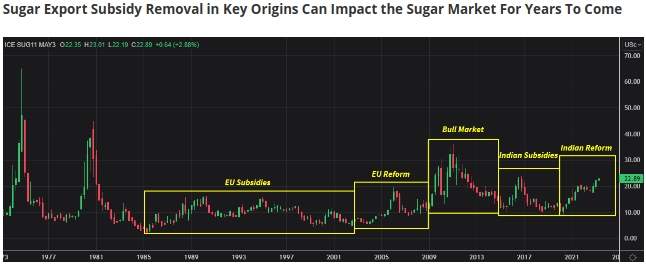
The conditions for the 2009-2011 rally emerged earlier in the decade. In the middle of the 2000s, the European sugar market was reformed in the face of a World Trade Organization challenge. Production was cut and subsidized sugar exports ceased. This removed plentiful low-priced sugar supply from the market and led to a brief rally to 20c in 2006.
Source: Refinitiv Eikon
Then, out of the economic wreckage of the global financial crisis, 2008/09 had the largest downturn in global sugar production on record, of nearly 20m tonnes. India’s sugar production fell from 28.5m tonnes in 2007/08 to 14.7m tonnes in 2008/09, with low sugar prices there leading farmers to switch away from cane to other crops. A poor monsoon didn’t help matters. It was clear India needed sugar imports and global sugar stocks started to fall.
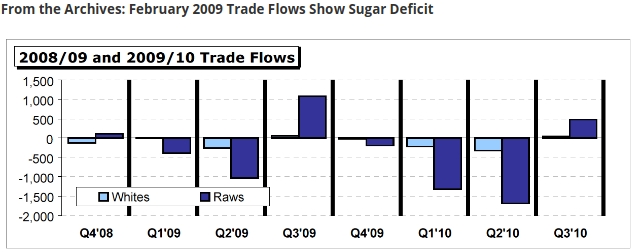
As we moved through the middle of 2009, an El Nino event formed. This can lead to dry weather in Northern Hemisphere cane regions, harming cane development, and wet weather in cane regions in Center-South Brazil, the world’s largest cane region.
Brazilian cane crushing in July, August and September was hit by wet weather, leading to a loss of 1.5m tonnes of sugar production. This sugar was urgently needed in India and elsewhere and the sugar market consequently rallied to 30c by February 2010.
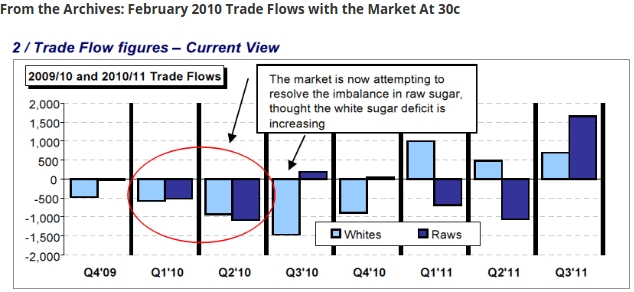
By this stage it was clear that El Nino would badly hit Northern Hemisphere cane sugar production too, leading to a second successive drawdown in global stocks. While you’d expect this to lead to further price strength, instead the sugar market collapsed.
Source: Refinitiv Eikon
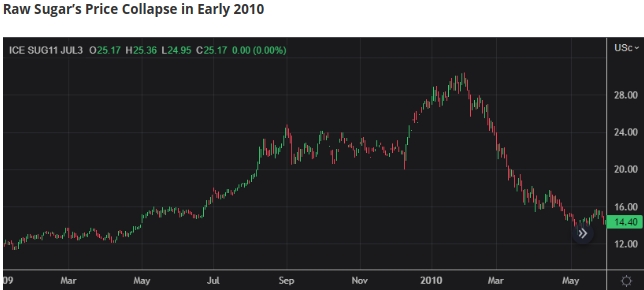
2010: Collapse to 13c
Speculators lost confidence in the market, having been happy to buy it at 30-year highs just days previously. This was perhaps triggered by higher-than-expected cane acreage in India.
A selling spiral emerged, driving prices all the way to 13c, made worse by algorithmic and trend-following trading systems. The market also expected that the 2010/11 season might deliver a small production surplus globally, thanks in part to a record CS Brazilian cane crop.
Source: Refinitiv Eikon
2010-11: Rally to 36c
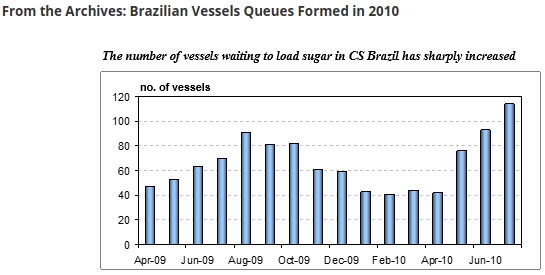
Despite this prospect of a small production surplus, global sugar stocks remained dangerously low through 2010. This created strong demand for physical sugar in H2’10, most of which had to come from Brazil.
Unprecedented queues of vessels waiting to berth appeared at Santos and Paranagua ports as Brazilian export logistics were unable to keep up. By early July the line-up of nominations extended until the end of August. The delays meant anyone needing prompt sugars had to pay premiums to ensure early dates, driving the sugar market higher. This shocked buyers who had hoped that the market would drift lower following the rally at the start of the year.
Even as El Nino seemed to be fading in H2’10, buyers short of price cover drove the sugar market ever higher.
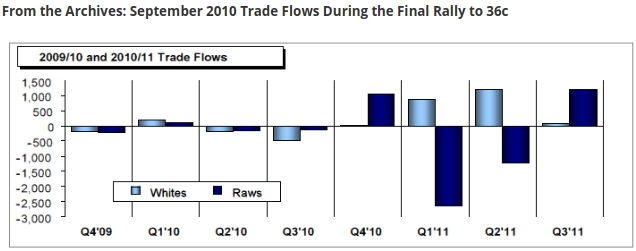
The buyer short-squeeze continued as CS Brazil’s 2010/11 cane crop limped to a poor close. Ageing cane and drought through the middle of 2010 resulted in low agricultural yields. Around 560m tonnes of cane was harvested, down from initial hopes of 590m tonnes. In Australia, heavy rainfall forced growers to leave nearly 20% of the cane crop in the ground. The EU harvest was disrupted by the early onset of wintry conditions leaving some beets unharvested while the Russian crop was devastated by a drought and extreme heat through the summer. Sugar production only reached 2.7m tonnes, 0.5m tonnes less than the previous year despite a 17.5% increase in sown acreage. Prices rallied to 36c.
Source: Refinitiv Eikon
What can we Learn from 2009-2011?
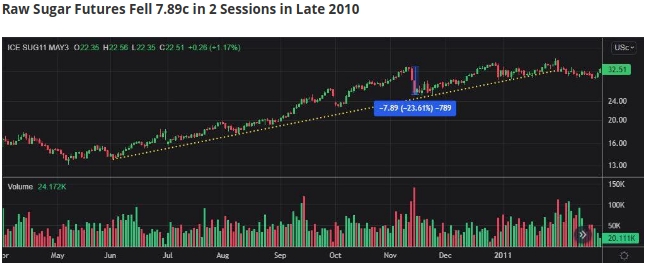
Firstly, strong commodity markets tend also to be volatile. Sugar stocks and supply around the world are unevenly distributed. The stress of low stocks can lead to fractures of normal supply chains and therefore strange price dynamics. In February 2010 the market had trebled from 10c to 30c in the space of 18 months. Only a crazy analyst would have said it would halve in the next 3 months. Yet it did. At one point in the final rally towards 36c the sugar market fell 8c in just 2 sessions.
Source: Refinitiv Eikon
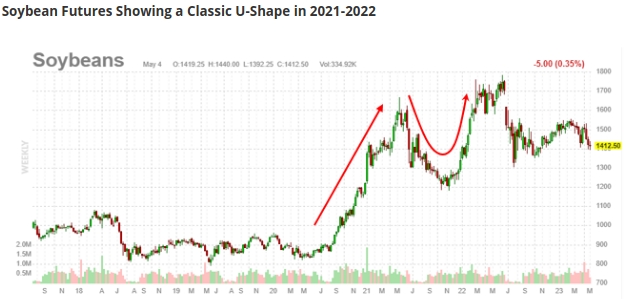
Secondly, when commodity markets strengthen because of structural supply problems, they need sustained high prices to resolve those problems. A sharp rally to 30c does nothing. This means that commodity markets can often rally, fade, then rally once more, leaving distinctive U-shaped patterns on price charts.
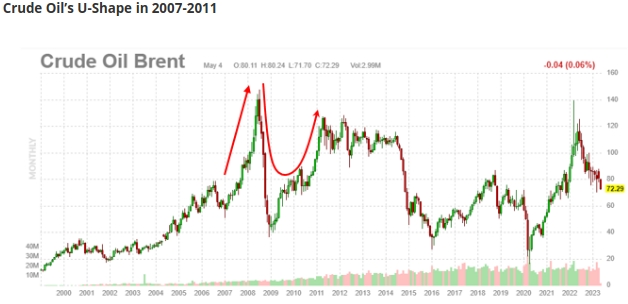
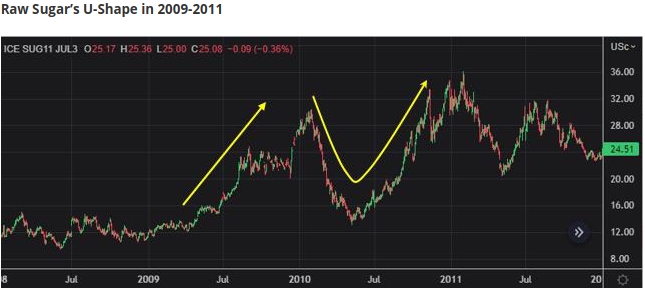
Source: Refinitiv Eikon
Thirdly, the news follows price action, not the other way around. The news looks the most bullish at the top. Market models such as trade flow analysis are reactive to events and price. Bull markets are about order flow and sentiment: markets are a succession of squeezes and in bull markets these squeezes are more severe than normal. But when the last distressed short is forced to cover, the rally is over. Newswires and fancy excel models won’t tell you when this has happened.
Today’s Bull Market
Many of the things we saw in 2009-2011 are repeating today.
The sugar market was pressured by subsidized Indian sugar supply pressing prices through the 2010s. These subsidies were challenged at the WTO and India has diverted sucrose towards ethanol production. The parallels with European sugar market reform and the 2009-2011 bull run are clear.
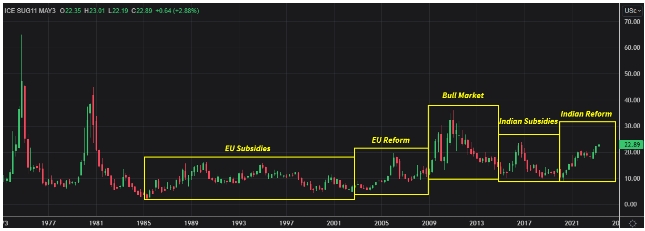
Source: Refinitiv Eikon
There’s also just been a buyers’ short squeeze in the sugar market in April, similar to the one we saw in H2’10. This year’s squeeze was helped by a shortfall in Northern Hemisphere cane sugar production in India, Thailand, Mexico, Pakistan and China.
It’s also possible that now the short squeeze is over, prices retreat in the short term, back towards levels where physical buyers – especially Chinese and re-export sugar refineries – are willing to secure sugar cargoes.
Source: Refinitiv Eikon
Bear in mind that we may yet in the longer term see a classic U-shape and a further rally in prices, perhaps as we move into 2024. It looks likely that El Nino is coming, we are dependent on Brazilian sugar supply this year and there are fears that its logistics won’t be able to cope with sugar demand. These are the same conditions that drove the market to 36c in 2010.
Source: Refinitiv Eikon