Insight Focus
- Huge shortfall in US soybean acreage vs estimates.
- Limited ability of Brazil and Argentina to respond.
- Soybean curve may backwardate to incentivise buyers to defer demand.
The below is the current US soybean supply and demand table forecasted by the USDA on June 9, 2023; it will get significantly revised next week…
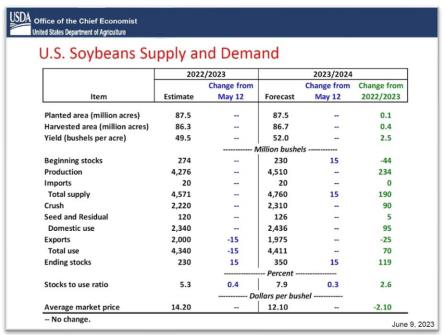
USDA economists must now reconfigure their estimates for the total supply (lower for certain) and demand (likely lower for all categories except for crush) due to this downward revision to forecasted US planted and harvested acreage issued on June 30…(note the changes in top producing IL and IA)
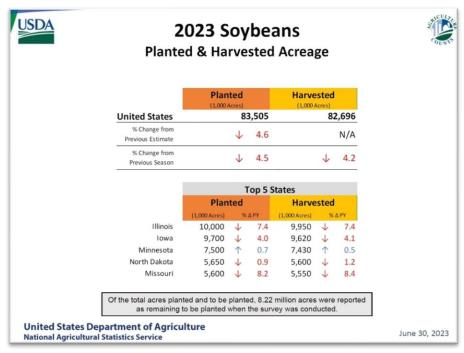
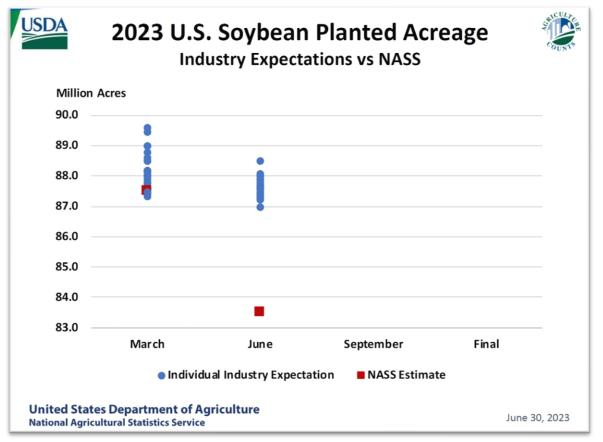
Which caught all the analysts USDA includes in their industry forecasting sample wrong footed as this chart displays…
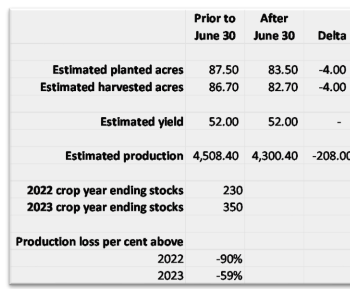
And the acreage impact, at a bare minimum, suggests the US will produce 208 million less bushels (60- pound bushel), which, put into perspective, is about 90% of this year’s reserve stocks…which is A LOT…
In effect, between now and the upcoming July World Agricultural Supply and Demand Estimates (WASDE) report, USDA economists must produce a US and global balance sheet that reflects the revised lower US acreage estimate that necessarily implies a forecasted smaller US soybean crop size for this year. The below table represents their June global production estimates prior to the June 30 acreage report.
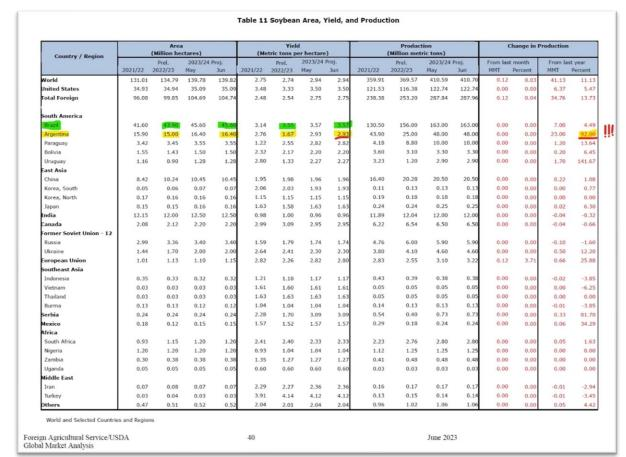
The top quarter of USDA’s world soybean supply table lays out the economists’ view for the Big 3 which includes these forecasts (and my conclusions on the coming changes highlighted in yellow and green):
- Greater world production via higher acreage and higher yield year on year (YoY); acreage will be revised lower.
- Greater US production via higher acreage and yield; acreage will be revised lower; another shock could be possible should the USDA economists use the July report to issue a forecasted yield reduction for this year’s crop given current below average crop condition ratings (that second shock to the balance sheet would be price explosive and more on that later).
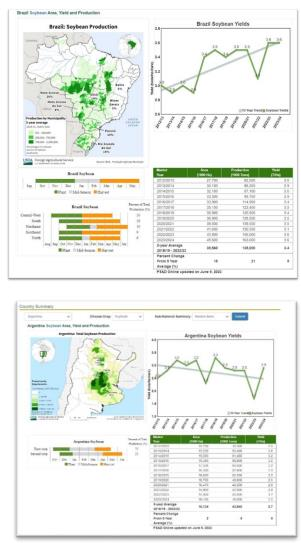
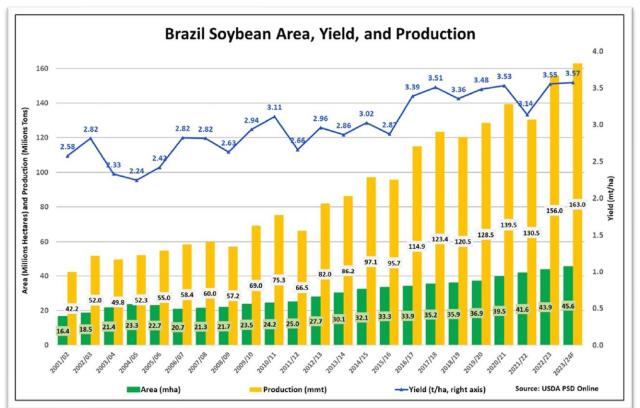
- Greater Brazilian production (the crop to be planted starting in September; see crop calendar below) via higher acreage and yield; maybe acreage gets revised HIGHER to offset US production losses and in recognition of Brazil’s capacity for sequential record production.
- Crazy high Significant Argentine production (the crop to be planted in November; see crop calendar below) via higher acreage and yield; USDA economists already forecasting a 92% increase in production YoY so no room to go higher.
Which brings us to the classic trader questions, what is the function of the market now (a question asked post any new, significant data input and the USDA revised soybean acreage estimate issued June 30 certainly meets the “significant” category) and how and when does the market send the signal? USDA’s shocking reduction in the US soybean planted acreage estimate means a smaller crop size and so less supply means higher prices, at least until the supply can expand again. That makes sense, right?
So now we traders can begin to draw a few conclusions about the function of the market: prices must go higher for a period of time to reflect the lower available US supply today yet still reflect the potential for global supply to recover because soybean production is a two hemisphere process and the LARGEST production comes from the southern hemisphere with farmers still making plans for the upcoming new crop production which kicks off in 60 days (see agronomic calendars above). Importantly, we traders must all go into next week’s report remembering the above world production table assumed RECORD Brazilian production already AND an end to the 9-year-old Argentine soybean production doom loop. So where do USDA economists “find” additional production to offset US losses? Dunno. (Hint: they don’t).
And this leads us to another conclusion about how the market sends a signal to the global consumer, primarily the soybean processor in China, given the decision by the US farmer to plant less soybeans and more corn than the market anticipated. The front part of the curve representing the diminished US supply, the September, November, and January 2024 contracts likely increase in price faster than the March, April, May, and July contracts, combined which represent the price signal for the soybeans crops to be harvested in Brazil and Argentina during those months in 2024. In classic commodity trader parlance, the curve will invert (backwardate for readers in Houston and London) to reflect the new reality of a smaller US soybean crop this year and the potential for larger Brazilian/Argentine (miracle) crops in 2024.
The extent to which prices need to discourage US soybean consumption and encourage Brazilian/Argentine soybean consumption via the futures curve by pricing the September through January futures contracts months higher (much?) than the March through July months will be a function of these following variables:
- Whether or not the USDA forecasts a US soybean yield reduction in the July WASDE which is not impossible given the national condition of the crop updated weekly by the USDA:
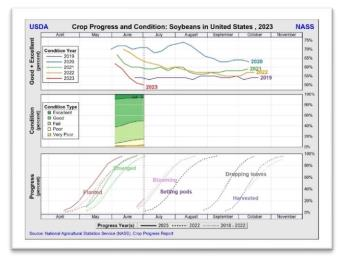

- This key state’s soybean crop condition and ability to recover (and please note the scaling highlighted in yellow is different than the above national chart):
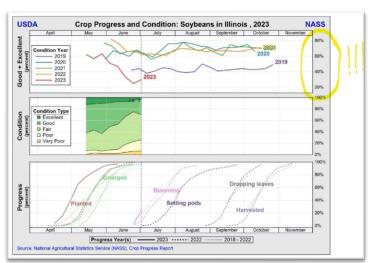
- The US soybean yield determinant period is upon us (see the blooming and setting pods stages highlighted in the two above charts) and soybeans are resilient so crop conditions may still improve dramatically but that requires recent rain patterns for the Midwest to remain in place through the next 60-90 days, especially for Illinois.
- The ongoing strength in the Brazilian Real relative to the US dollar requires more dollars (higher prices at the Chicago Mercantile Exchange where soybean futures are priced in dollars) to offset the Brazilian Real’s appreciation versus the dollar to keep promoting the Brazilian acreage expansion and fertilization for their 2023/24 record crop (again, already forecasted by the USDA).
- I have written about this enough times that I think many of you who read these posts know my sentiment (which is jaundiced by the last nine years of the soybean production doom loop cycle): does Argentina recover to make a somewhat normal soybean crop? As of today I am taking the “unders” with the caveat that a parabolic move higher in soybean prices driven by a yield reduction forecast by USDA economists in the upcoming WASDE report and/or adverse weather conditions during the key reproductive period of July/August/September would certainly incent Argentine farmers to produce to the full extent that they agronomically and financially can.
- To a lesser extent but still for consideration, can US farmers (mainly wheat growers) still plant soybeans following wheat/small grains harvest with enough time to add 25-50 million bushels of production to the US balance sheet.
Beyond the July WASDE report next week, the Q2 earnings calls from those publicly listed companies pursuing renewable diesel production with vegetable oil feedstocks may set a tone of “damn the torpedoes, full speed ahead” or “we will move forward with cautious baby steps” following EPA’s 2023- 2025 final RVO revision. This is the first earnings call cycle after EPA issued their final blend obligations and the first time that the following company’s management teams get to clarify their strategies after the EPA disappointed the collective feedstock and refining industries with limited expansion for obligations for renewable diesel blending.
I will do my level best to listen in to each of these calls:
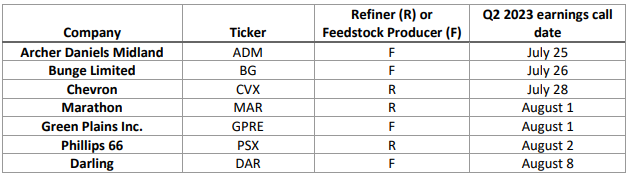
Remember the feedstock providers management teams (primarily ADM and BG) provided the “heads up” about the RD industry’s recent expansive purchases of vegetable oil feedstock that indicated demand had improved dramatically during the Q1 2023 earnings calls. A similar optimistic vegetable oil demand message combined with a “we believe in RD regardless of what the EPA has proposed” messaging about the RVO would provide a lot more upside momentum to the vegetable oil demand bull market unfolding today (which could soon morph into a supply bull market if weather proves adverse).
The next 90 days are significant in many ways for the global oilseed trade. Get off the beach and back to your trading desks everyone!