| Settlement (cUS$/lb) | Open | High | Low | Last | Volume | O/I | Life High | Life Low | |||
|---|---|---|---|---|---|---|---|---|---|---|---|
| Date | Spread | Date | Spread |
|---|---|---|---|
| Mar27 / May27 | 0.56 | Oct27 / Mar28 | -0.39 |
| Mar27 / Jul27 | 0.92 | Oct27 / May28 | 0.56 |
| Mar27 / Oct27 | 0.90 | Mar28 / May28 | 0.95 |
| Mar27 / Mar28 | 0.51 | Mar28 / Jul28 | 1.42 |
| May27 / Jul27 | 0.36 | May28 / Jul28 | 0.47 |
| May27 / Oct27 | 0.34 | May28 / Oct28 | 0.51 |
| Jul27 / Oct27 | -0.02 | Jul28 / Oct28 | 0.04 |
| Jul27 / Mar28 | -0.41 | Jul28 / Mar29 | -0.38 |
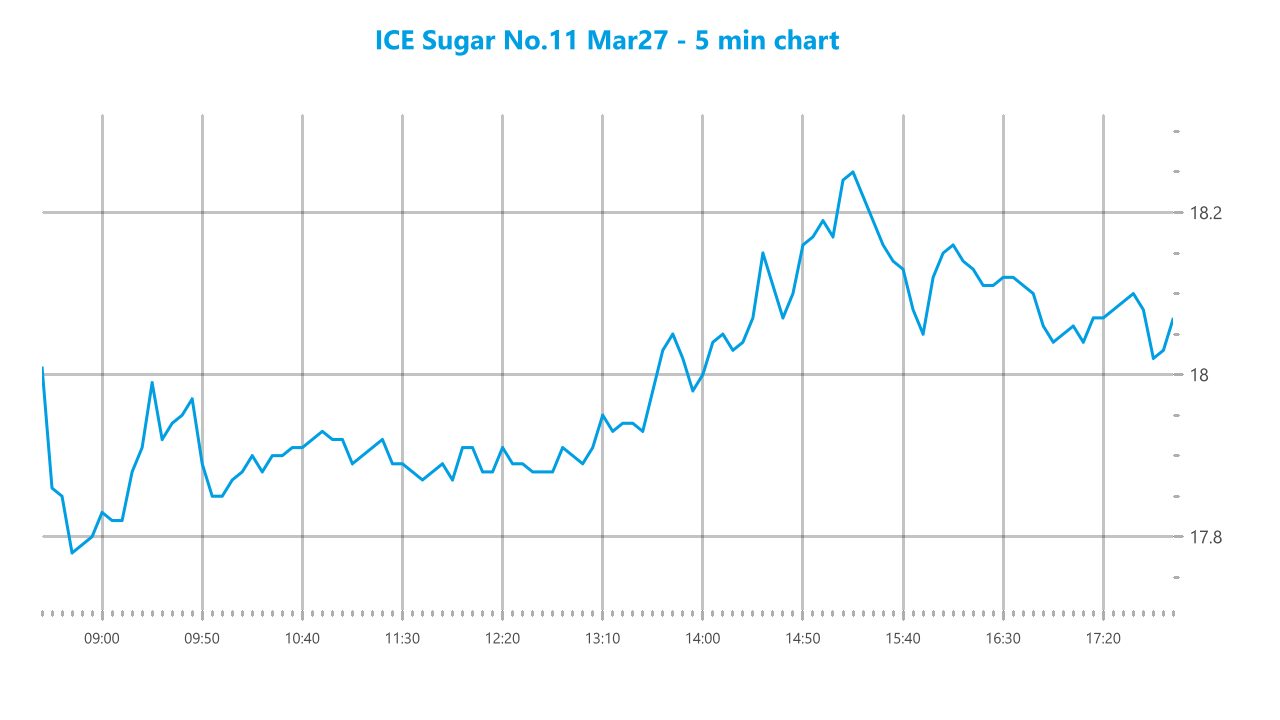
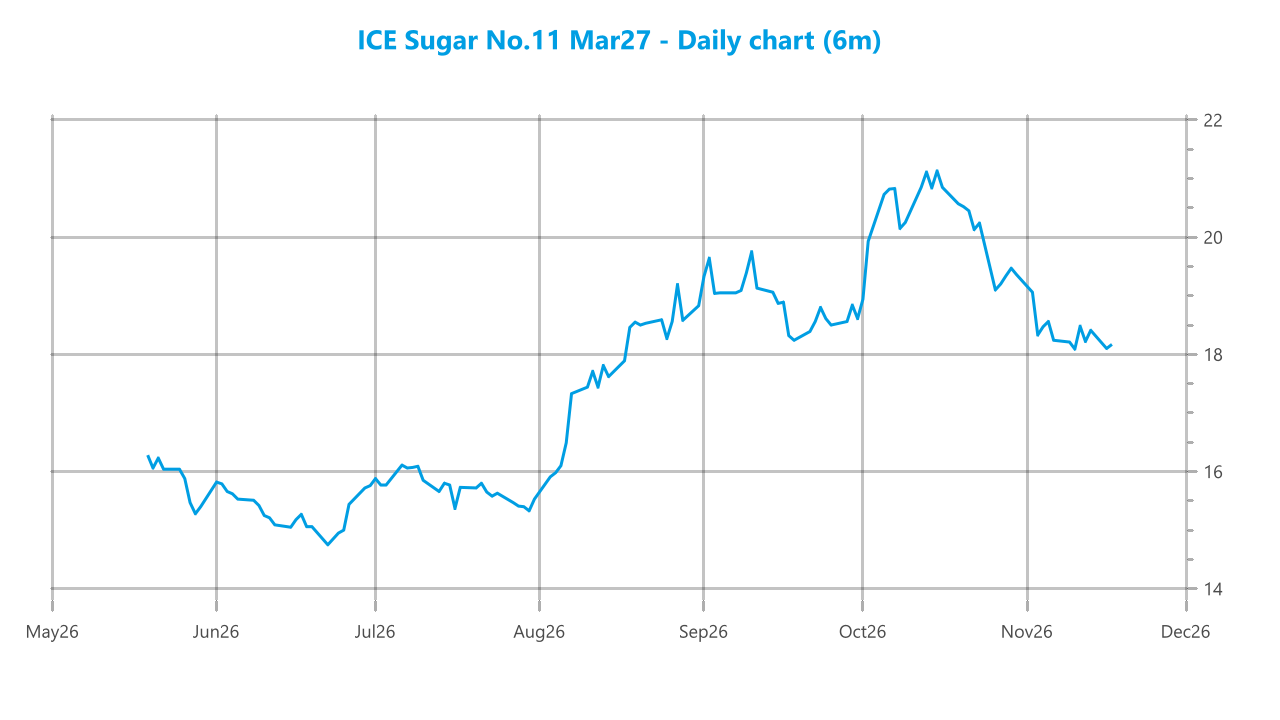
Having languished in the range for a few days while testing into the 17.90’s the market has shown an unconvincing desire to test lower, however another test from the start of todays session proved more effective. March’27 was slammed down to 17.75 against fresh selling and long liquidation, though it subsequently looked to hold ahead of this level following a short covering burst. Through the rest of the morning the price sat near to 17.90, providing a weak picture to those in the Americas when we reached the afternoon. With no additional selling from the funds this period drew additional short covering and the market climbed back up to a mid afternoon high at 18.26 before fading once more. It appears that the preferred direction for the smaller specs remains lower, and so through the remainder of the day we saw the price work back towards 18.00, sitting only just ahead of this mark ahead of the call. There was sufficient support for it to hold and March’27 ended the day at 18.04, bringing the curtain down on an unconvincing performance.
| Settlement (US$/mt) | Open | High | Low | Last | Volume | O/I | Life High | Life Low | |||
|---|---|---|---|---|---|---|---|---|---|---|---|
| Date | Spread | Date | Spread |
|---|---|---|---|
| Mar27 / May27 | -0.90 | May27 / Aug27 | 4.20 |
| Mar27 / Aug27 | 3.30 | Aug27 / Oct27 | 4.10 |
| Mar27 / Oct27 | 7.40 | Oct27 / Dec27 | 2.10 |
| Mar27 / Dec27 | 9.50 | Dec27 / Mar28 | -0.10 |
| Date | Premium | Date | Premium |
|---|---|---|---|
| Mar27 / Mar27 | 109.39 | Jul28 / Aug28 | 128.14 |
| May27 / May27 | 122.63 | Oct28 / Oct28 | 123.52 |
| Jul27 / Aug27 | 126.37 | Mar29 / Mar29 | 115.46 |
| Oct27 / Oct27 | 121.83 | May29 / May29 | 121.49 |
| Mar28 / Mar28 | 111.23 | Jul29 / Aug29 | 123.34 |
| May28 / May28 | 126.17 | Oct29 / Oct29 | 118.02 |
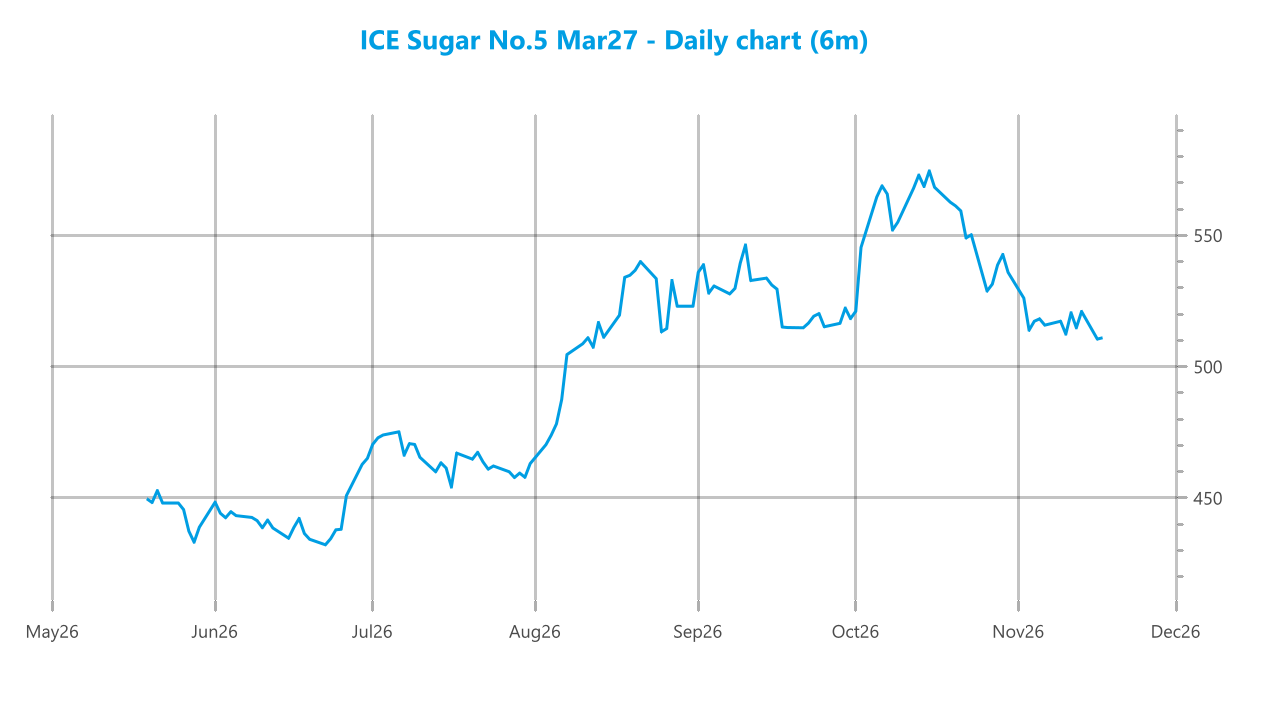
There was a sizable gap for the intraday chart as March’27 opened between $505.70 and $501.80 in reaction to weaker No.11 values. Though smaller traders were participating from both sides through the early morning we did not see any additional downside movement, instead remaining just above the lows as things calmed and sitting in the $503/$504 area through into the early afternoon. With the lows holding there eventually came a more substantial short covering move and March’27 reached a daily high at $510.90, though once all necessary cover had been taken it quickly slipped back into the range. Volumes dropped significantly through the last two hours as we sat in the centre of the daily band, with no fresh risk being taken on. Spread and white premium interest was low, and so the market simply drifted through the closing period to an eventual settlement level at $507.10, a daily loss which while away from the lows does maintain vulnerability should traders look to test beneath the psychologically significant $500.00 mark.