Insight Focus
- More than 40 countries have imposed sugar taxes in the last decade.
- Many of these taxes haven’t directly led to reductions in sugar consumption.
- We are yet to see conclusive signs obesity is falling as a result of taxation.

Executive Summary
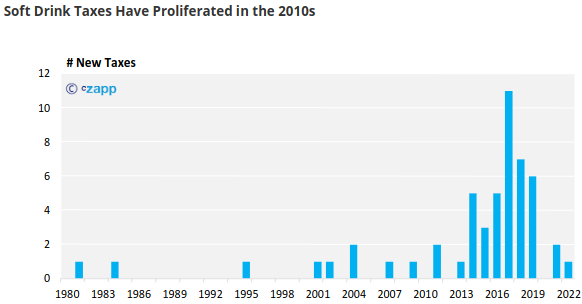
In the 2010s a wave of new sugar taxes and regulations have been imposed around the world. These were frequently justified as a way to combat obesity and associated non-communicable diseases.
We have now decided to try to assess whether these regulations have been effective in reducing obesity or indeed reducing sugar intake.
It’s extremely difficult to find robust data to support or disprove sugar tax effectiveness. Many expert studies do not use real-world data but instead rely on statistical modelling and counterfactuals – comparing what researchers thought would happen if the tax hadn’t been introduced with what did happen. However, policymakers and the public shouldn’t deal with what-ifs. They should judge effectiveness on real results.
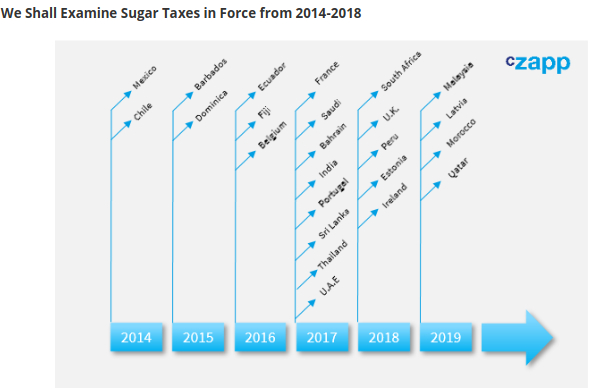
We’ve chosen to examine countries which have had a sugar tax in place for 5 years or more and for which there is sufficient high-quality data to draw meaningful conclusions.
Mexico’s sugar tax was introduced in 2014. United States Department of Agriculture statistics show per capita Mexican sugar consumption has been falling for almost 20 years. This trend pre-dates the tax but seems to have accelerated since 2017. The proportion of Mexican people who are obese continues to rise. The tax has raised revenue for the government, but we do not think this has been ringfenced for healthcare.
In Chile, per capita sugar consumption has been falling for longer than sugar taxes and marketing restrictions have been in force. Obesity rates continue to rise. The tax has raised revenue for the government, but we do not think this has been ringfenced for healthcare.
Thailand’s regulations might have had the most success of the countries we’ve assessed. Per capita sugar consumption is falling and the decline seems to have begun at around the time that a sugar tax was introduced. We cannot say if this was coincidental or not. We also do not have robust obesity data and so cannot tell if the tax has been successful at promoting weight loss. The tax has raised revenue for the government, but we do not think this has been ringfenced for healthcare.
In South Africa sugar consumption has been falling in South Africa for longer than a sugar tax has been in force. We haven’t found robust obesity data and so cannot tell what effect the tax has had on this factor. The tax has raised revenue for the government, but we do not think this has been ringfenced for healthcare.
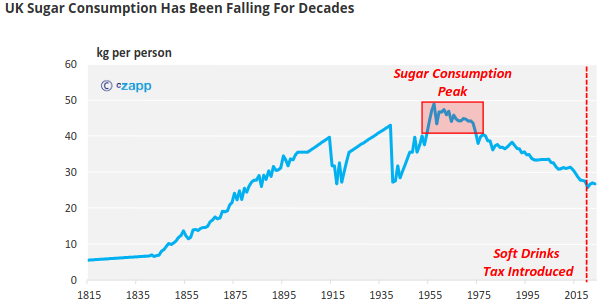
The UK government has introduced a soft drinks tax in 2018 and has also encouraged food and beverage manufacturers to reformulate products away from sugar since 2016. The soft drinks tax has led to widespread reformulation of soda. Other reformulation efforts have been disappointing, with sugar consumption in the government’s targeted categories rising in the 4 years to 2020. Nevertheless, per capita sugar consumption in the UK has been falling for at least 50 years and adult obesity rates continue to rise. Child obesity rates remain stable. The tax has raised revenue for the government, but this has not been ringfenced for healthcare.
In conclusion, we cannot find robust evidence that they reduce obesity rates in the countries we’ve studied. In many of these countries per capita sugar consumption has been falling for longer than the taxes have been in place. However, sugar taxes are excellent at raising government revenue.
Regulations can also be tailored to drive reformulation of foods and drinks away from sugar where this is scientifically possible. It’s easier to reformulate a drink than a cake. But consumers can be fickle and may abandon foods that don’t taste as they desire. WHO research suggests there may not be significant health benefits from reformulation alone.
A New Wave of Sugar Regulation
Sugar is one of the most heavily regulated foods in the world.
It’s being blamed for the steady increase of obesity and metabolic diseases like type 2 diabetes. Sugar is often a target because it’s not essential to human survival in the way that other macronutrients like protein or fat are.
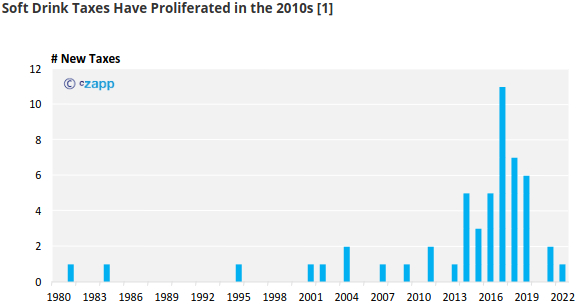
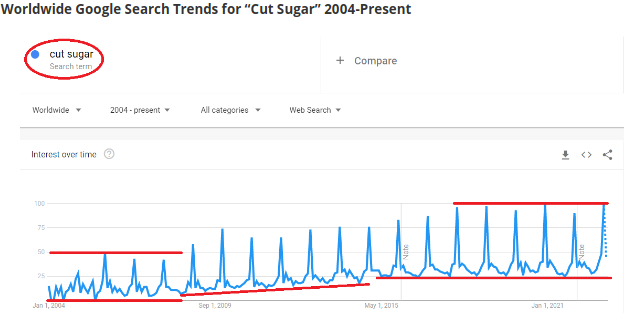
The tide began to turn against sugar in the early 2010s. Fat consumption became more acceptable and sugar consumption less so after several decades where the reverse was true. Consumers started to become more aware of their sugar intake. It’s possible the first wave of sugar taxes may have helped increase this awareness.
This first wave was led by Mexico and Chile. Mexico introduced a new soda tax in 2014, Chile amended its beverage tax in the same year. A flurry of regulations followed, peaking in the middle of the decade. Enthusiasm for new sugar taxes has since waned, perhaps because governments have been preoccupied with COVID and now food inflation.
With many of these taxes now several years old, we can try to assess whether they’ve been effective. We can judge in several ways:
- Did they lead to a reduction in obesity rates?
- Did they lead to a reduction in sugar consumption?
- Did they successfully raise government revenue, which might then be ring-fenced for healthcare?
A major problem has been the lack of available data. Food sales volumes are commercially sensitive information. Shopping surveys don’t often accurately record all calories consumed. Very few countries measure their populations’ height and weight robustly or regularly. Most of the data collection that does exist paused during COVID lockdowns.
It also takes time for shopping habits to change and health effects to be seen in the wider population. For this reason, we will only look at sugar taxes that have been in force for 5 years or more.
A further problem is the reticence of public health experts to use real-world data. They often rely on counterfactual studies, where they compare what they thought would have happened without the tax versus what really happened. This is so the researchers can control for factors such as the weather or economic outlook. But the research is then only as strong as the theory of what the world would have looked like. Policymakers and the public shouldn’t deal with what-ifs. They should judge effectiveness on real results. Please see the appendix on counterfactual studies for more information.
The subject of obesity, nutrition and sugar regulation can be emotive and political. This is unfortunate, because everyone in the debate wants food to be nutritious, tasty, cheap and widely available. The main point of difference in this debate is how we achieve this result.
We’ve examined many of the countries who enforced regulations on sugar between 2014 and 2018, but not all. This is because in some cases there was insufficient data to draw meaningful conclusions. If you are aware of data which may be helpful for this study, please let us know. Let’s get to work!
Mexico (Soft Drink Tax in 2014; Labels in 2020)
More than 2/3 of Mexico’s population are overweight, of which more than 1/3 are obese [2].
In 2014 the government announced a 10% flat tax on all industrialized sugar-sweetened beverages to make them more expensive to inhibit consumption. Very little reformulation happened: all soft drinks had the same price increase which was largely passed through to the consumer.
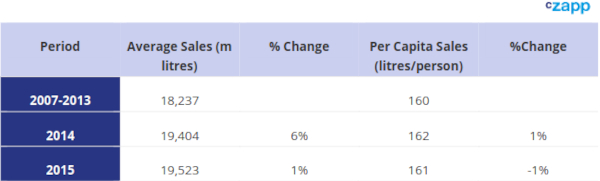
Data from the Mexican government showed that soft drink sales increased after the tax was imposed [3].
The government claimed that rather than looking at raw data, the findings should instead be compared to counterfactual guesses of what might have happened had the tax not been enforced.
Meanwhile, data from the Mexican Tax Service showed that the tax raised MXN 86.2b in its first 4 years, an average of MXN 21b each year. This equated to soft drink consumption above 160 litres per person per year [4].
However, most press attention was focused on counterfactual studies which were published, claiming the tax had led to reduced soft drink consumption compared to where it might have been without a tax, by around 5-10% [5, 6, 7]. A 10% reduction on 160 litres per year is around 44ml per person per day, accounting for just 16 calories.
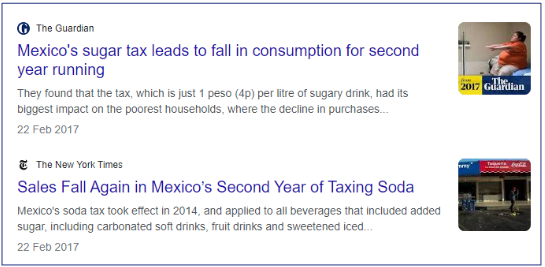
For more detail on counterfactual studies, please see the appendix. The short version: in theory the tax reduced Mexican soda consumption. In practice, the Mexican government’s data shows it did not. Consumers did not change their preferences.
Interestingly, the United States Department of Agriculture (USDA) believes that Mexican sweetener consumption may be in decline. They estimate per capita sugar consumption peaked in 2004 at around 48kg per person. However, some of this sugar was being replaced by High Fructose Corn Syrup (HFCS); sugar and HFCS consumption peaked in 2006 at 52kg per person [8].
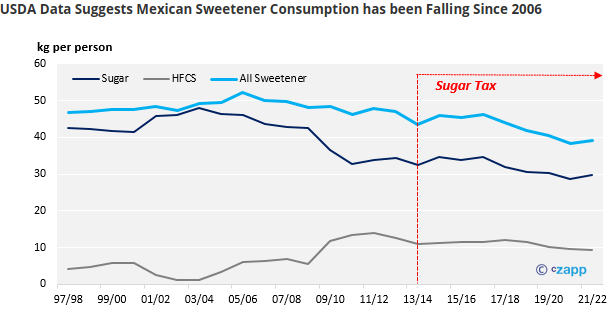
This means that per capita Mexican sweetener consumption has been falling for nearly 20 years, and that the fall pre-dates the introduction of the sugar tax. However, the data does suggest that the decline in sweetener consumption has accelerated since 2017. We cannot tell how much of this was due to the introduction of the sugar tax three years prior.
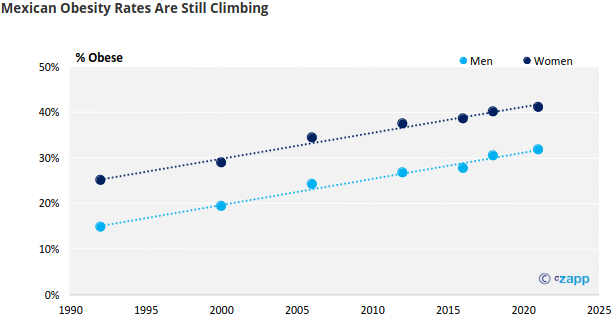
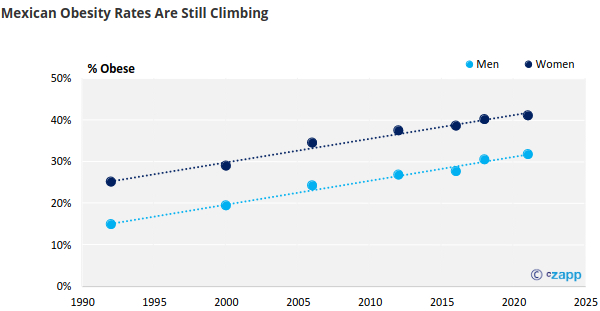
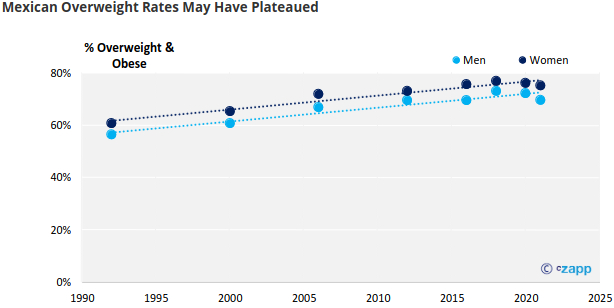
Despite sugar and HFCS consumption peaking nearly 20 years ago, obesity rates in Mexico continue to climb [2, 9]. However, rates of being overweight seem to have plateaued in the last decade. We do not know why overweight people have been better at managing their weight than obese people.
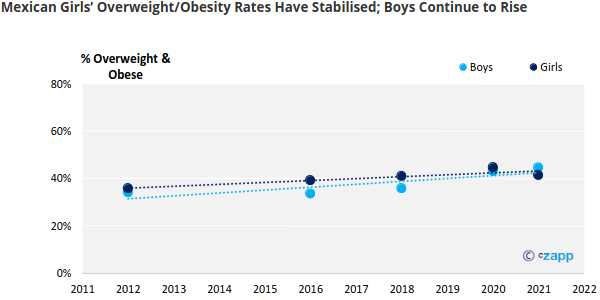
Bizarrely, this plateau has also been recorded for overweight/obese girls, but not boys. If you can help us understand the reason for these trends, please contact us.
Since 2020, Mexico has introduced front-of-pack labels to try to guide consumers to choose healthier foods and drinks. We won’t be able to assess their effectiveness for some time yet.
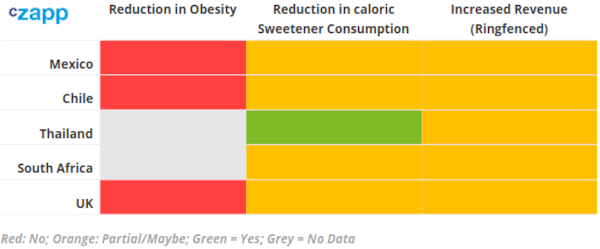
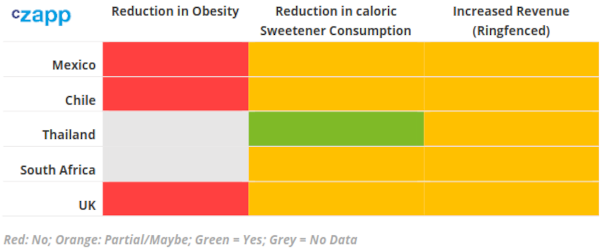
We can therefore score Mexico’s sugar tax as follows (and thought a traffic light system might be appropriate…):
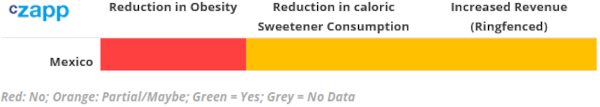
- Obesity rates are still rising (though the proportion of people who are not obese but are overweight is stable).
- Mexican per capita caloric sweetener consumption has been falling for much longer than the sugar tax has been in force.
- The tax has raised revenue for the government but this doesn’t seem to have been ringfenced for healthcare.
Chile (Soft Drink Tax Amendment in 2014; Labels in 2016)
Chile has a long history of beverage taxes. In 1979 the government introduced a 15% tax on all ‘industrialised’ beverages, whether sweetened, alcoholic or not. This was modified in October 2014 so that drinks with more than 6.25g of sugar per 100ml were taxed at 18%. Drinks below this level (including those with artificial sweeteners) were taxed at 10%. Dairy drinks, fruit drinks and water were untaxed.
As of February 2023, prices online for leading supermarket chain Lider showed no price difference for high-sugar and zero-sugar sodas, despite the different tax rates [10]. Even if the tax difference was reflected in prices, at supermarkets one litre of soda costs around 75c if bought in bulk. An 8% tax differential is unlikely to be large enough to be a deterrent to consumption.
Sodas Sold Online in Chile Cost the Same Despite the Tax Differential for Sugar Content
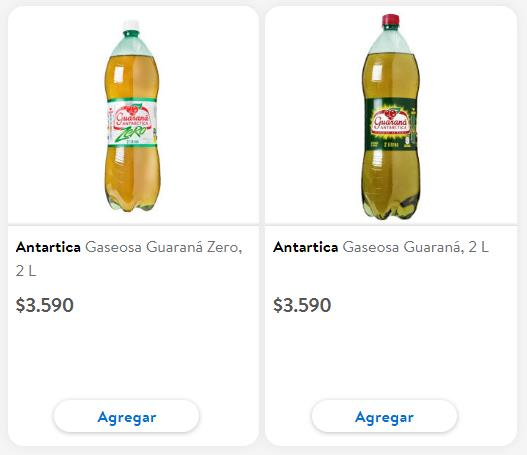
Source: Lider
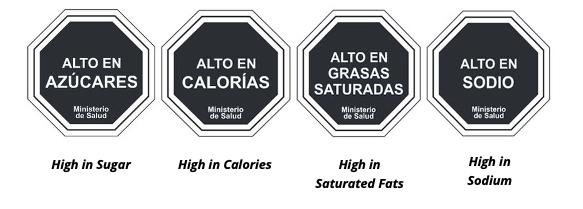
In 2016, Chile also implemented a new law on food labelling and advertising. This mandated front of pack warning labels for foods high in calories, saturated fat, sugar and sodium, restricted child marketing and banned sales in schools and nurseries.
Chile’s Front of Pack Warning Labels
Studies have struggled to show any sort of impact of these regulations on drinks sales unless they resorted to counterfactuals.
One showed an impressive-sounding 24% drop in soda sale compared to the counterfactual [11]. However, this translated to a 23ml saving per person per day, accounting for just 9 calories.
Another study stated that, “It is equally difficult to discern an obvious pre- versus post-tax pattern in any of the [soft drink] categories…” [12]. In plainer language, there was no change in recorded soda consumption, though the paper did manage to claim a 22% decline in soft drinks sales versus their counterfactual.
A third study found, “…no obvious changes in prices or purchases [of beverages] after tax implementation…” and claimed just a 3.4% decline in sales of high-sugar sodas versus their counterfactual [13].
In summary, two of the three studies showed no absolute reduction in soda purchases or consumption. Two of the three studies found declines versus counterfactuals (which cannot be scientifically falsified). The biggest decline versus a counterfactual led to only a 9 calorie per person per day saving.
For more detail on counterfactual studies, please see the appendix. The short version: in theory the regulations reduced Chilean soda consumption. In practice they did not.
Cz estimates Chilean sugar consumption each year. We do this by subtracting exports and adding imports to our forecast of local sugar production. We believe that sugar consumption peaked in the mid-to-late 2000s at around 44kg per person per year and has gently declined since.
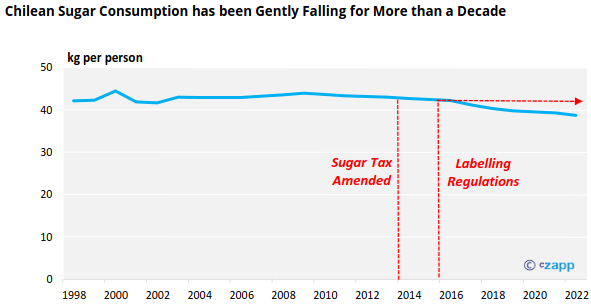
As with Mexico, the onset of the decline begins before the sugar tax and labelling regulations were introduced. Again, as with Mexico the rate of decline seems to have increased in recent years. We cannot tell how much of this was due to the introduction of the new regulations.
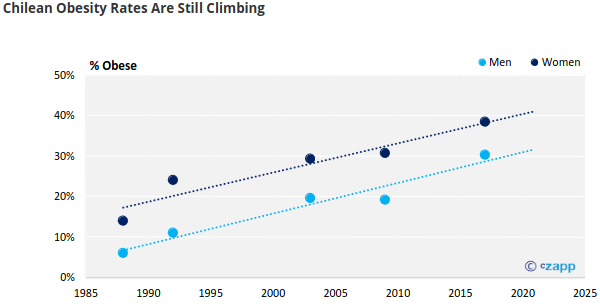
Despite sugar and HFCS consumption peaking nearly 20 years ago, obesity rates in Chile continue to climb [14]. Sadly, the most recent data we can find for adults dates to 2017, shortly after the introduction of the sugar regulations between 2014-2016.
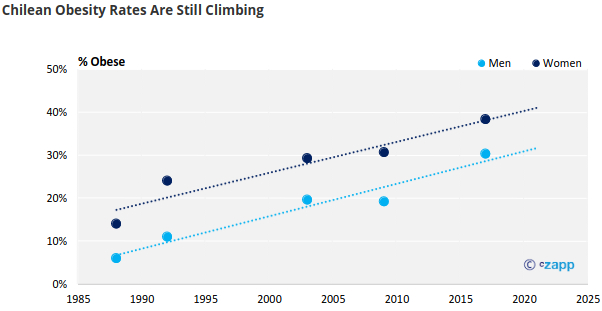
We are fortunate to have better-quality data for children in Chile. Each year the Ministry of Education’ National Board of School Aid and Scholarships measures the weight and height of children in the public school system between kindergarten and middle school 1st grade [15].
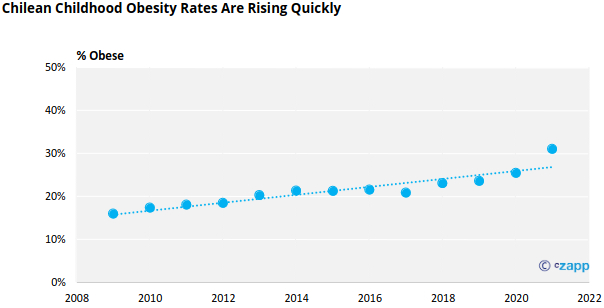
This data shows that while the proportion of overweight children has remained remarkably constant for the past 13 years, at around 28%, childhood obesity has more than doubled. The trend does not seem to have been affected by the sugar tax nor the sugar labelling regulations.
We can therefore score Chile’s sugar tax and regulations as follows:
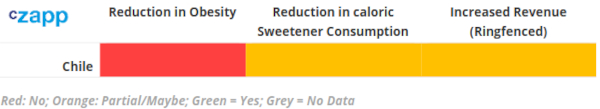
- Obesity rates are still rising.
- Chilean per capita caloric sweetener consumption has been falling for longer than the sugar tax has been in force.
- The tax has raised revenue for the government, but this doesn’t seem to have been ringfenced for healthcare.
Thailand (Soft Drink Tax in 2017)
In 2017 Thailand imposed a tiered soda tax, replacing an existing excise tax on non-alcoholic beverages. Under the new tax, the ad valorem rate was set at 0% for beverage concentrates, 10% for fruit juice and 14% for soda and carbonated drinks. These tax rates were also adjusted for the amount of sugar in the drink, with those containing more than 18g sugar per 100ml attracting the top rate.
The tax was combined with two other measures: an educational campaign called Fatless Belly Thais (FBT) and a soda ban in schools. The FBT program focused on the 3Es: eating, exercise and emotional control.
The sugar tax was introduced to try to reduce sugar consumption and therefore improve the health of the population. It was designed to increase every 2 years for a period of 6 years. However, the government has repeatedly delayed the arrival of the new higher tax rates.
There have been very few studies on the impact of the sugar tax on soft drink consumption in Thailand. One group of researchers used a statistical model to conclude that the tax might reduce soft drink consumption by 14%, but the authors themselves admitted the inputs were based on a literature review of global data as there was no empirical Thai data available [16]. They also assumed there were no substitution effects making the study entirely theoretical.
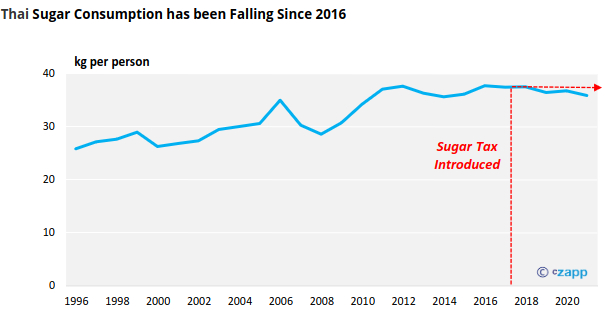
Cz estimates Thai sugar consumption each year. We do this by subtracting exports and adding imports to our forecast of local sugar production. We think that Thai sugar consumption peaked in 2016 at 38kg per person per year and has decline since this time. Intriguingly, the onset of this decline coincides with the introduction of Thailand’s sugar tax.
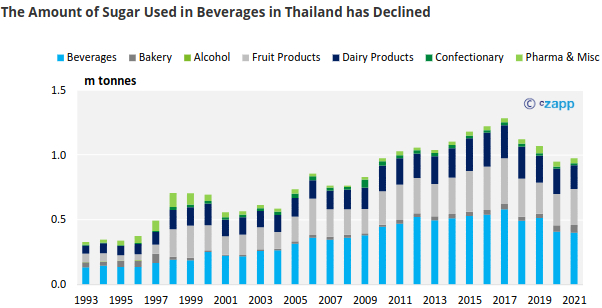
The USDA reports figures from the Thai Office of Cane and Sugar Board each year which outline how much sugar is used industrially in Thailand each year [17]. Sugar used by the beverage sector peaked in 2017 at 582k tonnes, and by 2021 had fallen to 403k tonnes.
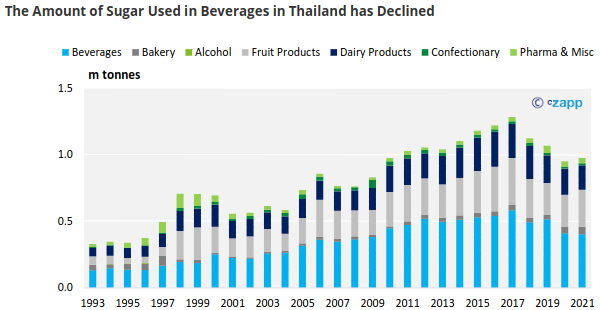
In per capita terms this is equivalent to sugar in drinks consumption falling from 23g per day to 16g per day, a saving of around 28 calories a day. While this is small when considered as a proportion of an adult’s 2,000 calorie per day requirement, it seems the sugar tax might have led to reduce sugar consumption, either through reduced beverage intake or reformulation of beverages away from sugar by manufacturers. On the other hand, it’s also possible that an increasing number of soft drinks were imported into Thailand and consumption was unchanged. The drop in per capita sugar intake around this time might have been entirely coincidental. We would welcome further research on the Thai food and beverage market to explore this topic.
We have struggled to find consistent and robust Thai obesity data, especially for the past decade. This makes it challenging to assess whether the sugar tax and reduction in sugar intake has had any impact on obesity rates.
For the chart below we have used an assortment of different published data points [18, 19, 20, 21, 22, 23]; please be aware that it’s likely that each data point follows a different methodology and so they are not strictly comparable. However, we thought it best to include the chart regardless to illustrate the approximate direction of travel.
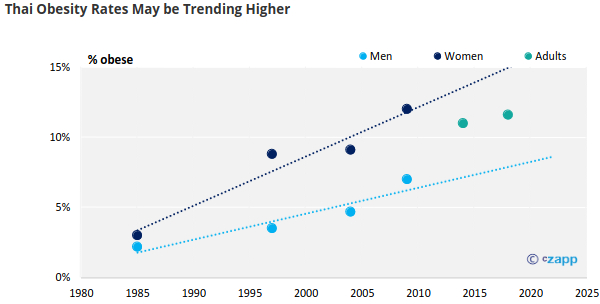
If you are aware of any relevant, recent and robust Thai obesity data, please do let us know.
We can therefore score Thailand’s sugar tax and regulations as follows:
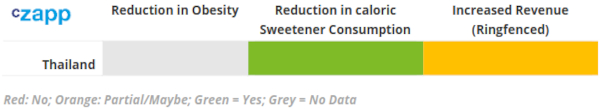
- We do not have robust Thai obesity data so cannot tell whether obesity rates are still rising.
- Thai per capita caloric sweetener consumption has been fallen since the sugar tax was imposed; we cannot tell if this is coincidental or a direct result of the tax.
- The tax has raised revenue for the government, but this doesn’t seem to have been ringfenced for healthcare.
South Africa (Soft Drink Tax in 2018)
In 2018, South Africa implemented the Health Promotion Levy, a ZAR 0.021 per gram of sugar tax on drinks containing more than 4g added caloric sweeteners per 100ml, excluding fruit juices. This was then raised to ZAR 0.0221 per gram of sugar in 2019.
This tax was largely passed through to consumers. Interestingly, one study found that both high and low sugar carbonated drinks saw prices increases following the introduction of the tax, even though low sugar drinks escaped the levy [24]. We have observed similar pricing behaviour in Chile.
In response, the local beverage industry reformulated some products to reduce the sugar content [25]. The USDA has estimated that reformulation of soft drinks led to a 30% drop in sugar usage among the beverage sector in 2018/19, accounting for 200k tonnes of sugar. As reformulation continued the following year, sugar consumption dropped by a further 50-100k tonnes in 2019/20. Reformulation stabilised in 2020/21 and sugar consumption rebounded by 150k tonnes, to leave it 100-150k tonnes lower than it was pre-tax. 150k tonnes of sugar is equivalent to 7g of sugar per person per day, or 28 calories, small when compared to an adult’s 2,000 calorie daily requirement.
The beverage sector also reported a reduction in demand of some reformulated products and gradual uptake of newly-introduced products [26]. In other words, consumers didn’t seem keen on those drinks which had sugar replaced with other sweeteners.
These findings were matched by a study which tracked Kantar Europanel monthly household purchase data from 2014-2019 [27]. This showed that the volume of taxable beverages consumed fell from 518.99ml per person per day to 443.39ml per person per day. Sugar consumed from taxable beverages fell from 16.25g per person per day before the tax was announced to 10.63g per person per day after the tax came into effect. The researchers didn’t assess if the lost 6g of sugar per day was made up elsewhere in the diet.
According to the study, the sugar content of taxable beverages therefore fell from 3.1g per 100ml to 2.4g per 100ml after the tax was introduced – evidence of reformulation. Another study estimated the sugar content of beverages purchased fell by 4.9g sugar per person per day, a 32% decrease [28]. Consumer switching accounted for around 70% of this and reformulation around 30%.
Yet another study of volunteers’ dietary recalls showed among taxed beverages, sugar intake decreased from 28.8g per person per day pre-tax to 19.8g post-tax [29]. However, among untaxed beverages sugar intake increased by 5.3g per person per day, for a net sugar decline of just 3.7g per person per day.
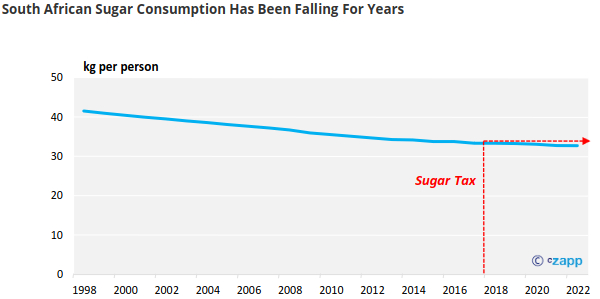
Cz estimates South African sugar consumption each year. We do this by subtracting exports and adding imports to our forecast of local sugar production. We believe that South African per capita sugar consumption has been falling, from above 40kg per person per year in the late 1990s to around 33kg per person per year currently.
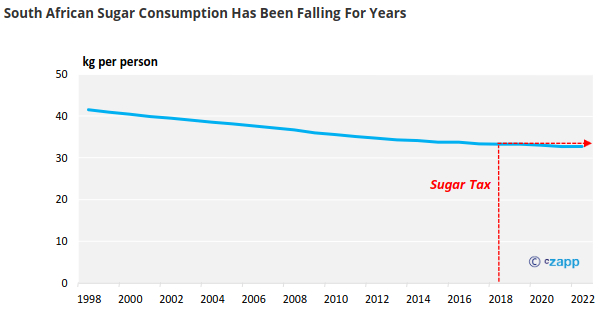
This fall in sugar consumption pre-dates the introduction of the sugar tax.
We have not been able to find any robust data for South African obesity rates which we can use to judge the effectiveness of the sugar tax. However, some sources suggest that obesity rates have been rising since the late 1990s, a period which coincides with our estimate of a decline in per capita sugar consumption [30]. If you are aware of any data we can use, please let us know.
In 2018 the tax had raised ZAR 2.3b revenue for the South African National Treasury. After 2 years this had risen to ZAR 5.8b. The revenue raised has not been earmarked for healthcare and has gone into the country’s general fund [31].
We can therefore score South Africa’s sugar tax and regulations as follows:
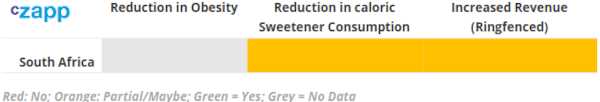
- We do not know if South African obesity rates are still rising.
- South African per capita caloric sweetener consumption has been falling for longer than the sugar tax has been in force.
- The tax has raised revenue but this has not been ringfenced for healthcare.
United Kingdom (Soft Drink Tax in 2018; Voluntary 20% Sugar Reductions to 2020; Ad Restrictions in 2022/3)
The UK announced a new tax on sugar-containing soft drinks in 2016, and the Soft Drinks Industry Levy came into force on in April 2018. The tax was specifically introduced to tackle childhood obesity and the revenue raised was initially intended to be ring-fenced for children’s health.
Soft drinks with at least 5g sugar per 100ml were included and taxed at GBP 0.18 per litre. Those with 8g or sugar or more per 100ml were taxes at a higher rate of GBP 0.24 per litre. Dairy drinks and fruit juices were exempt.
The tiered tax triggered widespread reformulation among unbranded soft drinks. Some branded drinks such as those made by Suntory (Ribena, Lucozade) and AG Barr (Irn Bru) were also reformulated so they contained less than 5g sugar per 100ml. However, many other branded soft drink companies retained high-sugar sodas and instead broadened their low and no sugar offerings. The cost of the tax was largely passed through to consumers.
Given the widespread reformulation, it’s no surprise that the amount of sugar consumed in soft drinks has dropped. The UK government estimates that sugar sales in soft drinks has fallen from 135k tonnes in 2015 to 89k tonnes in 2020 [32]. However, overall soft drink sales across all categories rose by 21.3% in this time.
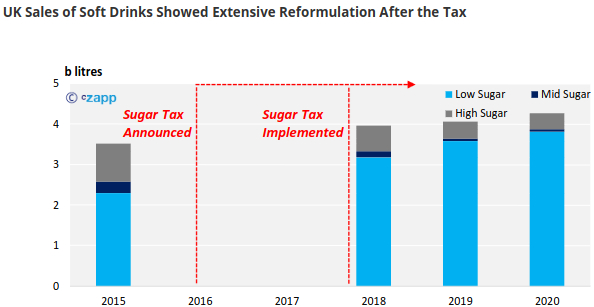
While these results seem impressive, UK government statistics show that sugary drink consumption has been falling for around 20 years, with low and no sugar sodas taking increasing market share [33]. In this context, the tax has merely accelerated a pre-existing trend.
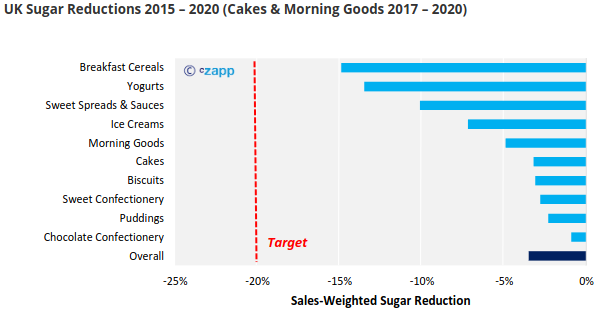
In addition to the sugar tax, the UK government encouraged manufacturers of high-sugar foods most commonly eaten by children to reduce sugar content by 20% on 2015’s levels by 2020, either through reformulation, changing portion sizes or nudging consumers towards low sugar options.
Reformulation is difficult to achieve. In soft drinks, sugar’s role is to provide a sweet taste, which can also be done with low calorie sweeteners. But in many other foods, sugar is a valuable ingredient.
Sugar is also hygroscopic, which means it attracts and retains moisture. This means that it can act as a preservative, drawing the moisture out of bacteria. You can see this effect in the centuries-old tradition of making jam to preserve fruits into winter and beyond. Synonyms for “jam” in the UK are “preserve” and “conserve”. Sugar’s moisture retention also helps give foods an attractive texture. Cakes without sugar are dry and crumbly. Ice creams without sugar have a thinner mouthfeel.
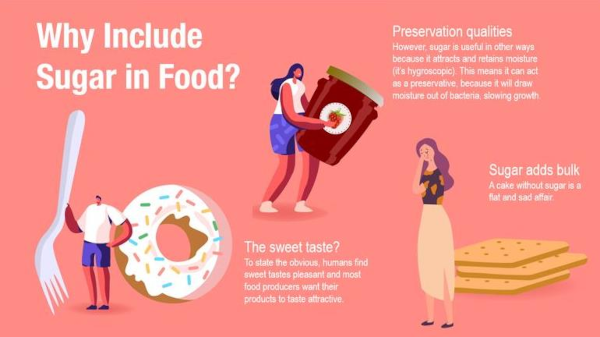
When sugar is heated it caramelizes. This helps cereals and biscuits to crisp, helps crust formation in bread and gives baked goods their appealing brown colour. Finally, sugar adds bulk. A cake without sugar is sad and flat unless it can be bulked out with another ingredient.
All of these properties come from one of the cheapest and most shelf-stable ingredients around. No wonder it’s hard to reformulate sugar out of many foods. This is backed up by UK government data showing the results of the reformulation drive to 2020.
The UK’s food manufacturers managed to reduce sugar content by just 3.5% across all categories between 2015 and 2020 on a sales weighted basis, far below the government’s 20% target. The products that were easiest to reformulate (breakfast cereals (-14.9%) and yogurt (-13.5%)) showed the largest reductions. There was almost no sugar reduction in cakes, biscuits, sweet confectionery, puddings and chocolate confectionery.
These changes meant that the amount of sugar sold in these products rose from 729k tonnes in 2015 to 781k tonnes in 2020, an increase of 7.1%. The 2020 figures are likely to have been skewed by the exceptional disruption caused to consumer behaviour by the COVID pandemic, but sugar consumed in these products in 2019 was 742k tonnes, an increase of nearly 2%. This is roughly aligned with UK population growth rates. In other words, there was no change in UK per capita sugar intake despite the reformulation.
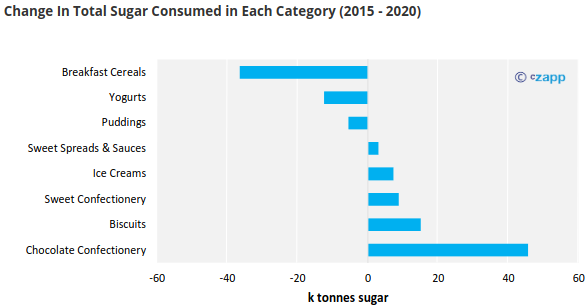
The total volume of food sold in these categories rose from 2.8m tonnes in 2015 to 3.0m tonnes in 2020, an increase of 8.1%. However, 2020 statistics were probably skewed by COVID restrictions. The volume of sales in 2019 was 2.9m tonnes, an increase over 2015 of 3.5%. Sales to 2019 fell in three categories: breakfast cereals (-0.5%), puddings (-3.0%), and yogurts (-3.3%); two of these categories had seen the biggest reductions in sugar content through reformulation.
In other words, consumers in the UK ate more high-sugar foods in 2019 and 2020 than they did in 2015 on a per capita basis. They also bought more of the foods which hadn’t been heavily reformulated, and less of those where the sugar reductions had been the greatest. Reformulation has led to people eating less cereal and yogurt, and more chocolate.
Furthermore, it’s not clear if replacing sugar with other sweeteners is beneficial for human health. Last July the WHO issued new draft guidelines on non-sugar sweeteners [34]. During a new review of scientific evidence, they found that people who consumed a lot of non-sugar sweeteners were more likely to gain weight over the long term. They have therefore said that non-sugar sweeteners should “not be used as a means of achieving weight control or reducing risk of non-communicable diseases” such as diabetes or heart disease. Bear in mind this is draft guidance and finalized guidelines will be released by the WHO in April following a peer review by an expert panel.
What effect has this barrage of regulation had on sugar consumption in the UK? Cz has been active in the UK sugar market for more than 150 years. Our data shows that sugar consumption peaked in the late 1950s and early 1960s and has fallen since. The fall in sugar consumption long pre-dates the sugar tax and further regulations.
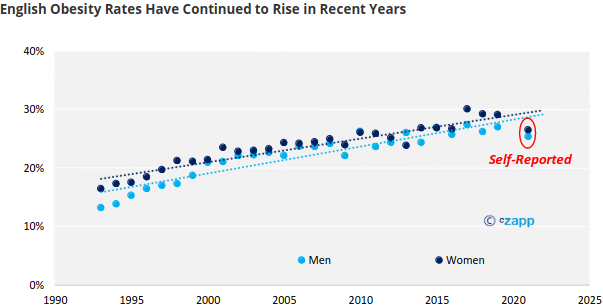
Through this time that sugar consumption has been falling, UK obesity rates have continued to rise. In England, rates have peaked at 30% for women and 27.4% for men in 2017 [35].
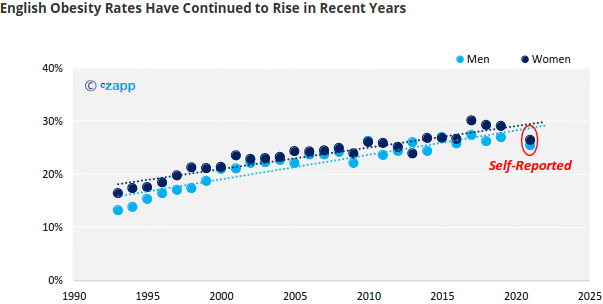
We are nervous about attaching too much weight to the 2021 statistics as they are self-reported and not physician measured. Time will tell how robust this data is and whether English obesity rates have finally plateaued.
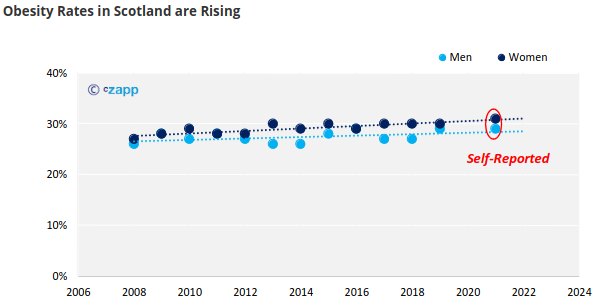
These trends are mirrored in other parts of the UK. For example, in Scotland, obesity rates also continue to rise [36].
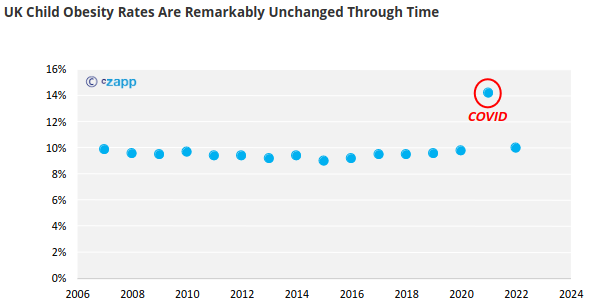
Even childhood obesity, the UK government’s chosen metric to assess performance, isn’t falling [37]. It’s remained stubbornly at just under 10% for more than a decade, apart from the time when COVID lockdowns were enforced.
Despite the lack of progress on reducing obesity, the UK government has been successful at raising revenue. The Soft Drinks Industry Levy has raised over GBP 1.3b since its inception [38]. However, His Majesty’s Treasury has confirmed that earlier plans to ring-fence the revenue to help tackle childhood obesity have been dropped [39].
We can therefore score UK’s sugar tax and regulations as follows:

- Obesity rates are still rising.
- UK per capita caloric sweetener consumption has been falling for longer than the sugar tax has been in force.
- The tax has raised revenue for the government, but this has not been ringfenced for healthcare.
Conclusions
The results of this survey are mixed.
For each country we have examined, we have been unable to find robust evidence that obesity rates are falling as a result of new sugar taxes and other regulations being imposed. This is disappointing seeing as the frequent justification for imposing sugar taxes is that they could reduce obesity rates and therefore healthcare burdens.
Another concerning observation is that obesity rates seem not to be falling even though per capita caloric sweetener consumption has been falling all these countries (except Thailand) for years. In many cases the fall in sugar consumption pre-dates sugar taxes, though it is possible the rate of caloric sweetener consumption in Mexico and Chile has accelerated as a result of the regulations in force.
Sugar taxes have been excellent at raising government revenue. It’s disappointing that this revenue frequently is absorbed in general funds rather than being ringfenced for healthcare purposes.
Do sugar taxes work? It depends on what you want them to do. If taxes are tiered according to sugar content, they can be used to drive reformulation away from sugar. But it’s easier to reformulate a drink than a cake. The example of the UK shows consumers can be fickle and may abandon foods that don’t taste as they desire. WHO research suggests there may not be significant health benefits from reformulation alone.
The WHO also admits that “…observational evidence on health improvements resulting from [sugar] taxes is currently sparse…” [41]
Making cheap food widely available is one of humanity’s finest achievements. Perhaps around 120b people have lived on Earth through all of history [40]. Very few of these people have lived without fear of hunger or starvation; the vast majority of this lucky group will have lived in the last 100 years. Even today, around 800m people don’t have enough to eat [42].
Obesity may be a problem of plenty – we have finally removed fear of hunger for most of the world’s population but haven’t figured out how to control our appetites accordingly. We are not aware of a single country in modern history which has managed to comprehensively reverse rising obesity without also descending into poverty. If you are aware of such an example, please let us know.
Sugar taxes have a hidden cost: they raise the price of food. Sugar taxes are generally passed through to consumers, which might prove difficult if inflation remains persistently high in years to come. It seems strange that sugar taxes may finally fall out of favour because they are too successful at raising revenue, not because they are ineffective at helping people lose weight.
Appendix 1 – Counterfactual Studies
How Does a Counterfactual Work?
Meet Bob. It’s 2007 and he works on Wall Street. He’s just been awarded a big bonus and decides to use it as a downpayment to buy a holiday home. He finances the rest of the purchase with a large mortgage.
Unfortunately for Bob the Global Financial Crisis hits and he loses his job in late-2008. He now has no Wall Street income, but he still must pay the mortgage. He calls his bank manager to explain, “I was earning well. More than enough to cover the mortgage. I was going to use my next bonus to pay down some of the debt. That’s what would have happened.”
Bob is giving a counterfactual: if things had gone in 2008 as they did in 2007, he’d have had enough money to pay for the holiday home. This might be true, but we’ll never know for certain.
But the bank manager doesn’t care for counterfactuals. He only cares about reality. He wants his mortgage payments and if they’re not forthcoming then he’ll foreclose.
We can do the same when judging sugar taxes. Researchers can hypothesize about what would have happened if the tax hadn’t come into force; that’s up to them. But policymakers committing to new regulations should be guided by reality.
Appendix 2 – Other Countries
France (Soft Drink Tax Amendment in 2018)
We have not been able to properly assess France due to a lack of data. If you know of any data on sugar/soft drink sales or obesity rates which may be helpful for our analysis, please let us know at jack@czapp.com.
France initially introduced a soda tax in 2013, where soft drinks with added sugar were taxed at EUR 7.5/hectolitre . This was changed in 2018 to a sliding scale tax for drinks containing more than 1g sugar per 100ml, rising to a maximum tax of EUR 20/hectolitre for drinks containing more than 11g sugar per 100ml.
In 2017, unlimited free refills of full-sugar and diet sodas were also banned in restaurants and other public catering spaces.
India (Soft Drink Tax in 2017)
We have not been able to properly assess India due to a lack of data. If you know of any data on sugar/soft drink sales or obesity rates which may be helpful for our analysis, please let us know at jack@czapp.com.
In 2017, India applied a premium 28% Goods and Services Tax rate to all drinks containing sugar or other sweetening matter, plus a further 12% cess for a 40% overall tax rate. Most-recent data from 2016 showed that only 4% of Indians were obese.
Soda purchases are also low, with one study [43] estimating urban consumption at 1 litre per person per year and rural consumption at 0.46 litres per person per year.
Gulf Cooperation Council (Soft Drink Tax in 2017)
We have not been able to properly assess the GCC due to a lack of data. If you know of any data on sugar/soft drink sales or obesity rates which may be helpful for our analysis, please let us know at jack@czapp.com.
The Gulf Cooperation Council introduced tax on high sugar drinks in 2017. A 100% tax rate was applied to energy drinks and a 50% tax rate to carbonated soft drinks, fruit juices and water. This was in response to high levels of obesity, which in Saudi Arabia had risen from around 20% of the adult population in 1989 to nearly 35% in 2015 [44].
References
1) Obesity Evidence Hub (2023), Countries that have taxes on sugar-sweetened beverages (SSBs), https://www.obesityevidencehub.org.au/collections/prevention/countries-that-have-implemented-taxes-on-sugar-sweetened-beverages-ssbs, accessed on 1/2/23
2) Global Obesity Observatory (2023), Mexico, https://data.worldobesity.org/country/mexico-139/, accessed 1/2/23
3) Instituto Nacional de Salud Pública (2016), ¿Por qué no es posible concluir sobre la utilidad del impuesto a las bebidas azucaradas en México en 2015 usando datos directos de ventas?, https://www.insp.mx/epppo/blog/4043-compra-venta-bebidas-azucaradas.html, accessed 1/2/23.
4) FoodBev Media (2018), Lessons from Mexico: ‘Our sugar tax hasn’t worked’, says beverage association, https://www.foodbev.com/news/lessons-mexico-sugar-tax-hasnt-worked-says-beverage-association/, accessed 1/2/23.
5) Health Affairs, 2017; 36(3):564-71; Colchero MA, Rivera-Dommarco J, Popkin BM, and Ng SW, In Mexico, Evidence Of Sustained Consumer Response Two Years After Implementing A Sugar-Sweetened Beverage Tax, https://www.healthaffairs.org/doi/full/10.1377/hlthaff.2016.1231, accessed 1/2/23
6) PLoS ONE 11(9): e0163463; Colchero MA, Guerrero-López CM, Molina M, Rivera JA (2016), Beverages Sales in Mexico before and after Implementation of a Sugar Sweetened Beverage Tax, https://journals.plos.org/plosone/article?id=10.1371/journal.pone.0163463, accessed 1/2/23
7) BMJ 2016;352:h6704; Colchero MA, Rivera-Dommarco J, Popkin BM, and Ng SW, Beverage purchases from stores in Mexico under the excise tax on sugar sweetened beverages: observational study, https://www.bmj.com/content/352/bmj.h6704, accessed 1/2/23
8) United States Department of Agriculture (2023), Table 56a Mexico: Sugar production and supply, and sugar and high-fructose corn syrup utilization, by fiscal year, metric tons, tel quel, since 1995/96, https://www.ers.usda.gov/webdocs/DataFiles/53304/Group%204%20Tables%20-%20Fiscal%20Year%20US%20and%20MX%20Supply%20and%20Use.xlsx?v=359.3, accessed 1/2/23
9) Instituto Nacional de Salud Pública (2022); Shamah-Levy T, Romero-Martínez M, Barrientos-Gutiérrez T, Cuevas-Nasu L, Bautista-Arredondo S, Colchero MA, Gaona-Pineda EB, Lazcano-Ponce E,Martínez-Barnetche J, Alpuche-Arana C, Rivera-Dommarco J., Encuesta Nacional de Salud y Nutrición 2021 sobre Covid-19. Resultados nacionales. Cuernavaca, México: Instituto Nacional de Salud Pública, https://ensanut.insp.mx/encuestas/ensanutcontinua2021/informes.php, accessed 1/2/23.
10) Líder (2023), https://www.lider.cl/supermercado/category/Bebidas_y_Licores/Bebidas, accessed 2/2/23
11) PLoS Med. 2020 Feb 11;17(2):e1003015; Taillie LS, Reyes M, Colchero MA, Popkin B, Corvalán C., An evaluation of Chile’s Law of Food Labeling and Advertising on sugar-sweetened beverage purchases from 2015 to 2017: A before-and-after study, https://www.ncbi.nlm.nih.gov/pmc/articles/PMC7012389/, accessed 2/2/23
12) PLoS Med 15(7): e1002596 (2018); Nakamura R, Mirelman AJ, Cuadrado C, Silva-Illanes N, Dunstan J, Suhrcke M, Evaluating the 2014 sugar-sweetened beverage tax in Chile: An observational study in urban areas, https://journals.plos.org/plosmedicine/article?id=10.1371/journal.pmed.1002596, accessed 2/2/23
13) PLoS Med. 2018 Jul 3;15(7):e1002597; Caro JC, Corvalán C, Reyes M, Silva A, Popkin B, Taillie LS., Chile’s 2014 sugar-sweetened beverage tax and changes in prices and purchases of sugar-sweetened beverages: An observational study in an urban environment, https://www.ncbi.nlm.nih.gov/pmc/articles/PMC6029755/, accessed 22/2/23
14) Global Obesity Observatory (2023), Chile, https://data.worldobesity.org/country/chile-41, accessed 2/2/23
15) JUNAEB Mapa Nutricional (2023), https://www.junaeb.cl/mapa-nutricional, accessed 2/2/23
16) PLoS One. 2021 Apr 29;16(4):e0250841; Phonsuk P, Vongmongkol V, Ponguttha S, Suphanchaimat R, Rojroongwasinkul N, Swinburn BA. Impacts of a sugar sweetened beverage tax on body mass index and obesity in Thailand: A modelling study, https://www.ncbi.nlm.nih.gov/pmc/articles/PMC8084227/, accessed 2/2/23.
17) USDA Foreign Agricultural Service Global Agricultural Information Network (2022) Sugar Annual: Thailand, https://www.fas.usda.gov/data/thailand-sugar-annual-6, accessed 2/2/23
18) Progress in obesity research, 1991:649-53; Tanphaichitr V, Kulapongse S, Pakpeankitvatana R, et al., Prevalence of obesity and its associated risks in urban Thais, https://data.worldobesity.org/country/thailand-214/#data_prevalence, accessed 3/2/23
19) J Med Assoc Thai 2004;87(6):685-93; Aekplakorn W, Chaiyapong Y, Neal B, Chariyalertsak W, Kunanusont C, Phoolcharoen W, Suriyawongpaisal P., Prevalence and Determinants of Overweight and Obesity in Thai Adults: Results of the Second National Health Examination Survey, https://pubmed.ncbi.nlm.nih.gov/15279350/, accessed 3/2/23
20) Obesity Reviews, 10: 589 – 592; Aekplakorn W and Mo-Suwan L. (2009)., Prevalence of obesity in Thailand, https://onlinelibrary.wiley.com/doi/abs/10.1111/j.1467-789X.2009.00626.x, accessed 3/2/23
21) J Obes. 2014:410259; Wichai Aekplakorn, Rungkarn Inthawong, Pattapong Kessomboon, et al., Prevalence and Trends of Obesity and Association with Socioeconomic Status in Thai Adults: National Health Examination Surveys, 1991–2009, https://www.ncbi.nlm.nih.gov/pmc/articles/PMC3976913/, accessed 3/2/23
22) PLoS ONE 15(1): e0226286 (2020); Yan LD, Hanvoravongchai P, Aekplakorn W, Chariyalertsak S, Kessomboon P, Assanangkornchai S, et al, Universal coverage but unmet need: National and regional estimates of attrition across the diabetes care continuum in Thailand, https://journals.plos.org/plosone/article?id=10.1371/journal.pone.0226286, accessed 3/2/23
23) BMC Public Health 20, 850 (2020); Sakboonyarat, B., Pornpongsawad, C., Sangkool, T. et al., Trends, prevalence and associated factors of obesity among adults in a rural community in Thailand: serial cross-sectional surveys, 2012 and 2018, https://bmcpublichealth.biomedcentral.com/articles/10.1186/s12889-020-09004-w, accessed 3/2/23
24) Soc Sci Med. 2019 Oct;238:112465; Stacey N, Mudara C, Ng SW, van Walbeek C, Hofman K, Edoka I., Sugar-based beverage taxes and beverage prices: Evidence from South Africa’s Health Promotion Levy., https://pubmed.ncbi.nlm.nih.gov/31472286/, accessed 3/2/23
25) USDA Foreign Agricultural Service Global Agricultural Information Network (2022) Sugar Annual: South Africa, https://www.fas.usda.gov/data/south-africa-sugar-annual-6, accessed 2/2/23
26) USDA Foreign Agricultural Service Global Agricultural Information Network (2019) South Africa: South African Sugar Industry Crushed by Not So Sweet Tax, https://www.fas.usda.gov/data/south-africa-south-african-sugar-industry-crushed-not-so-sweet-tax, accessed 3/2/23
27) Lancet Planetary Health, The, 2021-04-01, Volume 5, Issue 4, Pages e200-e208; Nicholas Stacey, Ijeoma Edoka, Karen Hofman, Elizabeth C Swart, Barry Popkin and Shu Wen Ng, Changes in beverage purchases following the announcement and implementation of South Africa’s Health Promotion Levy: an observational study, https://www.clinicalkey.com/#!/content/playContent/1-s2.0-S2542519620303041, accessed 3/2/23
28) Economics & Human Biology, Volume 46, August 2022, 101136; Maxime Bercholz, Shu Wen Ng, Nicholas Stacey, Elizabeth C. Swart, Decomposing consumer and producer effects on sugar from beverage purchases after a sugar-based tax on beverages in South Africa, https://www.sciencedirect.com/science/article/abs/pii/S1570677X22000326?via%3Dihub, accessed 3/2/23
29) PLoS Med. 2021 May 25;18(5):e1003574; Essman M, Taillie LS, Frank T, Ng SW, Popkin BM, Swart EC., Taxed and untaxed beverage intake by South African young adults after a national sugar-sweetened beverage tax: A before-and-after study, https://pubmed.ncbi.nlm.nih.gov/34032809/, accessed 3/2/23
30) Global Obesity Observatory (2023), South Africa, https://data.worldobesity.org/country/south-africa-197/, accessed 3/2/23
31) Obesity Reviews, Volume22, Issue9, September 2021, e13301; Karen J. Hofman, Nicholas Stacey, Elizabeth C. Swart, Barry M. Popkin, Shu Wen Ng, South Africa’s Health Promotion Levy: Excise tax findings and equity potential, https://onlinelibrary.wiley.com/doi/10.1111/obr.13301, accessed 3/2/23
32) Office for Health Improvement & Disparities (2022), Sugar reduction – industry progress 2015 to 2020, https://www.gov.uk/government/publications/sugar-reduction-programme-industry-progress-2015-to-2020, accessed 3/2/23
33) Department for Environment, Food and Rural Affairs (2022), Family Food Statistics, https://www.gov.uk/government/collections/family-food-statistics, accessed 3/2/23
34) World Health Organization (2022), Health effects of the use of non-sugar sweeteners: a systematic review and meta-analysis, https://www.who.int/publications/i/item/9789240046429, accessed 3/2/23
35) National Health Service (2022), Health Survey for England, 2021 Part 1, https://digital.nhs.uk/data-and-information/publications/statistical/health-survey-for-england/2021, accessed 6/2/23
36) Scottish Government (2022), The Scottish Health Survey 2021 https://scotland.shinyapps.io/sg-scottish-health-survey/, accessed 6/2/23
37) Office for Health Improvement & Disparities (2022), National Child Measurement Programme Obesity Profile, https://fingertips.phe.org.uk/profile/national-child-measurement-programme, accessed 6/2/23
38) HM Revenue & Customs (2022), Soft Drinks Industry Levy Statistics Commentary 2022, https://www.gov.uk/government/statistics/soft-drinks-industry-levy-statistics, accessed 6/2/23
39) The Grocer (2019), Soft drinks sugar levy revenues swallowed up by Treasury Review, https://www.thegrocer.co.uk/health/soft-drinks-sugar-levy-revenues-swallowed-up-by-treasury-review/597309.article, accessed 6/2/23
40) National Institute of Corrections (2021), How Many People Have Ever Lived on Earth?, https://info.nicic.gov/ces/global/population-demographics/how-many-people-have-ever-lived-earth, accessed 6/2/23
41) World Health Organization (2022), WHO manual on sugar-sweetened beverage taxation policies to promote healthy diets, https://www.who.int/publications/i/item/9789240056299, accessed 1/2/23.
42) Action Against Hunger (2023), World Hunger Facts, https://www.actionagainsthunger.org.uk/why-hunger/world-hunger-facts, accessed 6/2/23
43) Glob Food Sec. 2019 Dec;23:191-204; Law C, Green R, Kadiyala S, Shankar B, Knai C, Brown KA, Dangour AD, Cornelsen L, Purchase trends of processed foods and beverages in urban India, https://pubmed.ncbi.nlm.nih.gov/31799110/, accessed 6/2/23
44) Weqaya The National Centre for Disease Prevention and Control (2019), Obesity Control and Prevention Strategy 2030, https://ianphi.org/_includes/documents/sections/tools-resources/annual-meetings/2019annualmeeting/obesity-prevention-control-strategy.pdf, accessed 6/2/23