2,220 words / 11 minute reading time
- Sugar taxes are spreading around the world.
- In some cases this is changing consumer behaviour or driving reformulation of food and drink.
- Global sugar consumption has been hit as a result, contributing to today’s high sugar stocks.
The Spread of Sugar Taxes
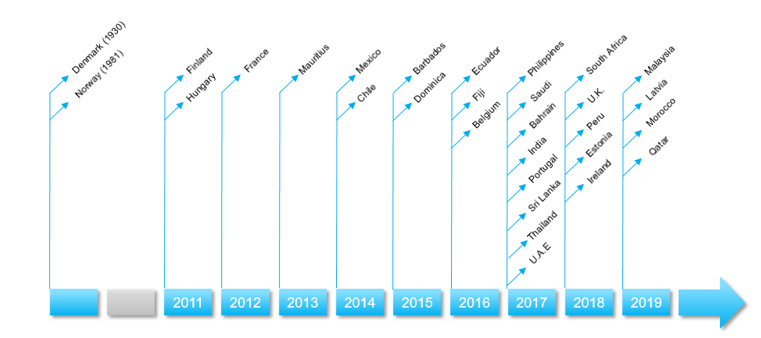
Taxes are universally hated. But sugar taxes are increasing in number; since 2014 their use has blossomed.Now they have been introduced they are not
going to go away.
Timeline of Sugar Taxation
Why tax sugar? In most cases, governments have introduced sugar taxes because they are trying to improve health. Being overweight increases the chance of having a range of health problems. This then creates a burden on health services. Governments believe consumers can be encouraged to reduce their calorie intake with the right incentives. However, bear in mind sugar taxes have another happy side-effect for governments. They raise revenue.
Sugar taxes rarely apply to sugar. In almost all cases, sugar taxes are actually sugary drinks taxes. The major exception is Hungary1, which applies a tax across a range of food and drinks that the government considers unhealthy.
This is because soft drinks can easily be reformulated with non-sugar sweeteners; diet drinks have existed for decades. Using other sweeteners may change the flavour of a drink but not much else. This isn’t true for other goods like biscuits, cereals or ice creams, where sugar might act as a bulking agent, might be needed for browning or might help retain moisture. Many governments also see soft drinks as a form of empty calories. They don’t deliver other nutritional benefits, whereas a milkshake gives calcium and vitamin D, for example.
Broadly speaking, soft drink taxes come in two forms: flat rate and tiered. Which form the tax takes may have a bearing on its effectiveness. Let’s take a look at some examples.
Flat Taxes: Mexico
Mexico is one of the most overweight countries in the world. One third of Mexicans are obese2, two-thirds are overweight. Around 70% of the added sugars that Mexicans consume each day come from soft drinks3.
Metabolic Syndrome is One of the Largest Health Problems in Mexico
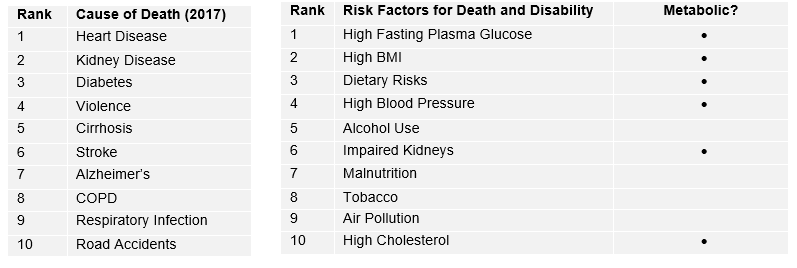
Diabetes is the third largest killer in Mexico after heart disease and kidney disease4. Diabetes can lead to chronic kidney disease; if we group causes of death into families it’s clear that metabolic syndrome is a major problem.
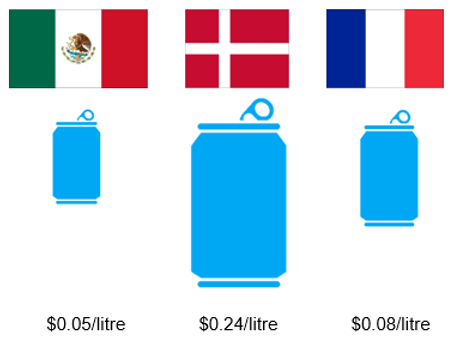
In 2013 the government proposed a 10% flat tax on all “industrialised sugar-sweetened beverages”. This became law on 1st January 2014. The aim was to make soft drinks more expensive to inhibit consumption. The tax equates to approximately 1 Mexican Peso per litre, or $0.05/litre at today’s exchange rate.
Very little reformulation of soft drinks was seen as a result of the tax. All sugary drinks faced the same price increase, which was largely passed onto the consumer.
Immediately after the tax was introduced sugary soft drink consumption fell. A study by the Mexican Institute of Public Health5 found that sales of soft drinks fell by 5.5% in 2014 and another 9.7% in 2015. Untaxed drinks sales rose in this period by more than 2%. The largest decrease in soft drinks purchases came from the lowest income groups.
Mexican Soft Drink Consumption
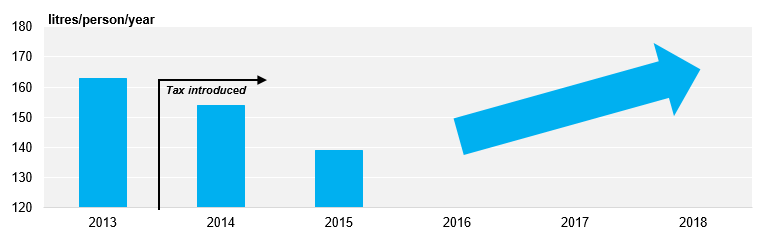
However, after the initial success, things started to go wrong. Data from the Mexican Tax Service6 showed the soft drinks tax raised MXN 86.2b in its first four years. This is an average of MXN 21b per year, which equates to per capita sugary drink consumption above 160 litres. In plain English, people adjusted to the new price and their old habits returned.
The chart above combines two different data sets and so may not be completely robust. However, the conclusion that consumers only adjusted their habits for a short period of time has also been found by the Mexican government’s National Institute of Statistics and Geography and also by the private data analysis firm Canadean7.
In revenue terms the soft drinks tax in Mexico has been a success. But if the aim was to reduce soft drink consumption, it has not. We also don’t know if it’s achieved any health improvements across the population because the health effects of being overweight can take years to develop.
Flat Taxes: Other Countries
Let’s look at other long-standing examples of flat sugar taxes. Denmark imposed a DKR 1.64/litre ($0.24/litre) tax on soft drinks in the 1930s, but this was removed in 20148. Rather than pay the tax, many consumers shopped in Sweden or Germany for soft drinks instead.
France imposed a tax on soft drinks in 2012, on full-sugar and diet versions. Soft drinks sales declined in the year after introduction by only 2%. The tax was changed in the middle of 2018 to a tiered tax depending on sugar content of the drink, which has started to drive reformulation9.
Denmark and France Have Amended Their Flat Sugar Taxes in Recent Years
The remaining flat taxes around the world have been introduced too recently to be able to draw any meaningful conclusions. Recall how many taxes have been introduced in the last 5 years. We should get increasing amounts of data about the effectiveness of these taxes in the years to come.
Tiered Taxes: Chile
Chile is the world’s largest consumer of soft drinks per person. Three quarters of the population is overweight; 44% of children are overweight10. It began taxing soft drinks in the 1960s, but the tax took its current form in 2014.
Drinks with a sugar content of more than 6.25g per 100ml were taxed at 18%; those below this level were at 10%. This led to a $0.11/litre price differential using today’s exchange rate. Plain milk, sweetened milk, fruit juices and water were taxed.
Chile’s Sugar Tax Introduces a Differential Between High and Low Sugar Drinks
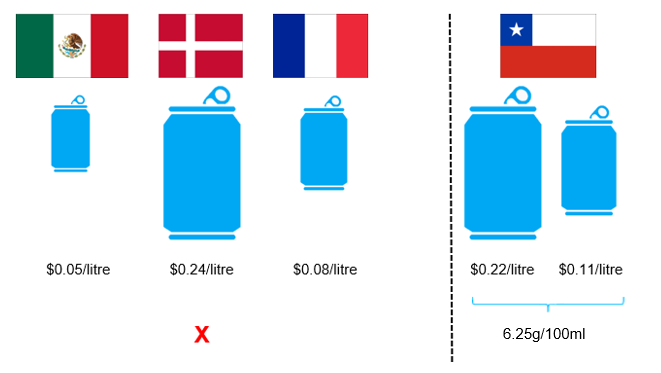
In the year that followed, one study found that the amount of sugar bought in soft drinks fell by 21%11. Another found that high sugar drinks purchases fell 3.4%12. The studies both used different methodologies, hence the different outcomes, but both agree that sales of high-sugar drinks fell.
Sadly, there are no studies which demonstrate if the fall in purchases was sustained, or was temporary as in Mexico. And so far there’s been no change in Chile’s health outcomes either.
Chile Has Adopted Radical New Packaging Laws For A Range of Foods
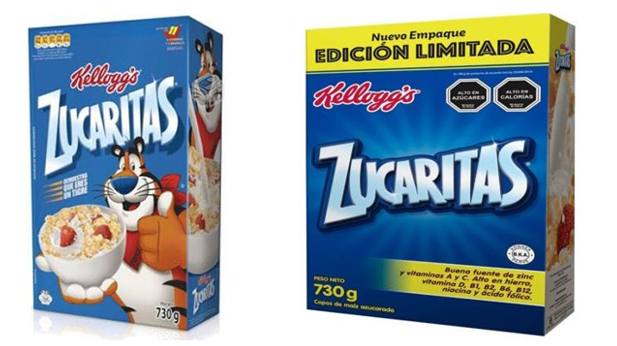
Interestingly, Chile has also adopted other measures beyond taxation. In 2016 the advertising of foods deemed unhealthy to children was heavily regulated. Mascots and promotional toys were banned. Labels now warns when foods are high in sugar, fat or calories. Kellogg’s and Pepsi are fighting this in the courts, saying the government regulations infringe on their intellectual property.
Tiered Taxes: United Kingdom
The UK Soft Drinks Industry Levy was announced in 2016 and became law in April 2018. It was specifically introduced to combat childhood obesity, with the revenue raised ring-fenced to be reinvested into children’s’ health.
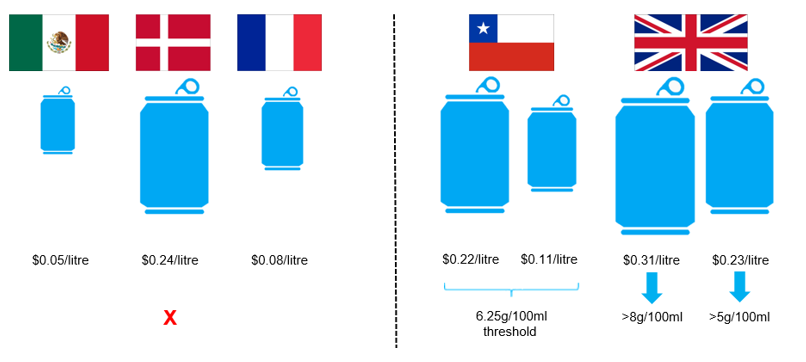
Drinks with more than 8g sugar per 100ml were taxed at 24p per litre. Drinks with more than 5g sugar per 100ml were taxed at 18p per litre. Drinks with nutritional benefit such as milk and fruit juices were exempt.
The UK’s Soft Drink Tax in Context
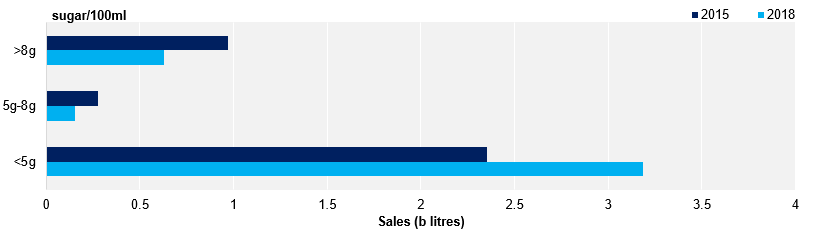
Between 2015 and 2018 the total sugar content of drinks sold decreased by more than 20%13. The total amount of sugar sold in soft drinks fell from 140k tonnes in 2015 to 110k tonnes in 2018, replaced with around 150 tonnes artificial sweetener.
UK Sales of Soft Drinks by Sugar Content
Most non-branded drinks have been reformulated away from sugar into other sweeteners. Major brands had two choices. Some widened the choice available to consumers. This was Coca-Cola’s strategy.
Industry Response to the Soft Drinks Tax
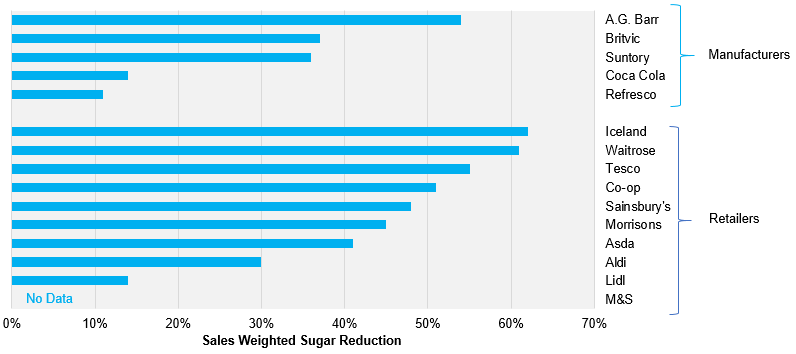
Full-sugar Coca-Cola is the company’s flagship product and the recipe will not change. However, Coca Cola have diversified their range of drinks in the UK. Diet Coke and Coke Zero are exempt from the taxation and as a result they cost less. The portion size of full sugar Coca-Cola is often smaller than that of its non-sugar cousins.
Coca Cola have also introduced zero sugar versions of Fanta and Sprite. The company recently bought the UK coffee chain Costa Coffee for $5b and so has a portfolio of drinks available in the UK, giving consumers the choice about what they drink.
Other companies, like AG Barr, reformulated all of their drinks. AG Barr are perhaps best known for the vivid orange soft drink called Irn Bru, which is especially popular in Scotland. It used to have 10.3g sugar per 100ml, so would have been in the higher tax bracket. Ahead of the tax implementation, the company reformulated the drink to 4.7g sugar per 100ml at a cost of £1.4m.
The change was not universally popular. Drinkers went online to vent their anger: a petition to stop the company from changing the recipe received 54,000 signatures14 (1% of the Scottish population) but to no effect. The drink changed. Today, out of date cans of full-sugar Irn Bru can be found on eBay at up to £12 each15.
The company’s financial performance has also turned. H1 revenues before tax for 2019 have reversed 6 years of growth16. Annual profits are expected to be 20% lower in 2019 than they were in 2018.
AG Barr H1 Profit Before Tax has Fallen in 2019
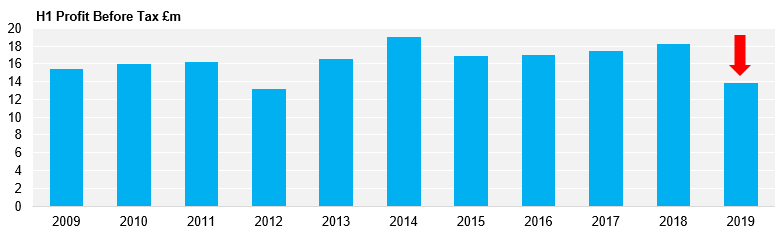
This can’t be solely attributed to changing their recipes. But it may be a factor. Interestingly, the company recently announced17 it had stumbled across the original Irn Bru recipe from 1901 and was going to release it as a limited edition drink from 2nd December, paying the full sugar tax. It has 10.5g sugar per 100ml. The company has also launched an Irn Bru energy drink, which is in the higher tax category at 11g/100ml.
Has the UK tax been a success? The problem for the UK government is that while sugar consumption in soft drinks has fallen since 2018, the total tonnage of sugar eaten in products that are part of the UK government’s sugar-reduction strategy has risen by 2.6%18. There’s also been no change in the amount of calories eaten in a single occasion. This means the government is likely to use other methods alongside the soft drinks tax, perhaps making packaging sizes smaller, for example.
There is scope for the scale of the sugar tax to increase. Compare the sugar tax to the UK’s other sin taxes. Imagine a group of friends who all go to a bar. They each have a drink of beer, except one who is the designated driver and has a soft drink. They go outside for a smoke (because the government has banned smoking indoors), then one drives the rest home. Here’s the per serving breakdown of the taxes, all excluding VAT.
A Comparison of the UK’s “Sin Taxes”
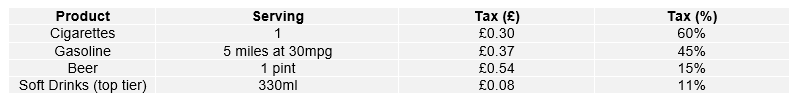
The soft drinks tax is the lowest by all measures.
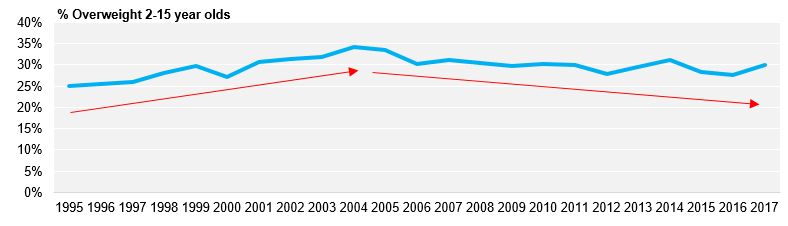
From a health point of view we don’t have any data to show if the UK’s strategy is delivering results, either through reduced childhood obesity, or reduced dental disease, or reduced metabolic syndrome incidence. The government’s chosen measure of childhood obesity stops in 2017, before the tax was introduced. Interestingly, childhood obesity has been flat for more than a decade19. Will it fall in the future? We don’t know yet, and until we do the government is likely to continue to regulate.
UK Childhood Obesity is Not Getting Worse
What Does This Mean for the Sugar Market?
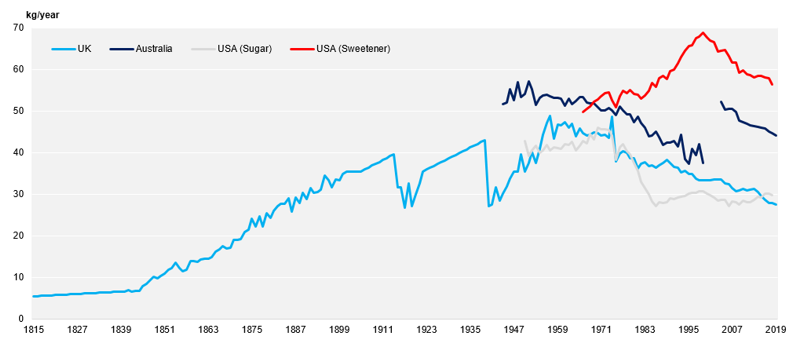
In many English-speaking countries, per capita sugar consumption has been falling for years with no obvious impact on health. This is an unexpected challenge to the growth of sugar taxation. Excessive sugar consumption over the long term might lead to bad health outcomes when combined with other diet and exercise choices, but it’s not clear if it can be solely implicated. This may mean that solely targeting sugar could be bad policy.
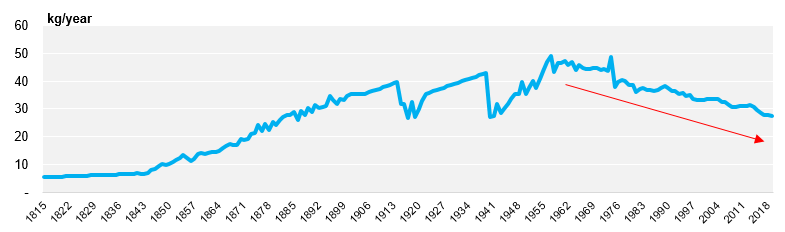
The fall in per capita sugar consumption has been observed in the UK since the 1970s, and so pre-dates the Soft Drinks Industry Levy.
UK Per Capita Sugar Consumption is Falling
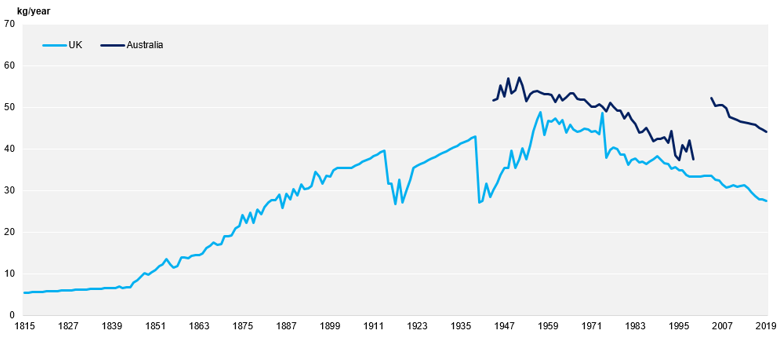
It’s also true in Australia. The data to 1999 is from the Australian government20. Thereafter it’s Czarnikow’s. Frustratingly we use a different methodology, but the trend remains the same.
Australian Per Capita Sugar Consumption is Falling
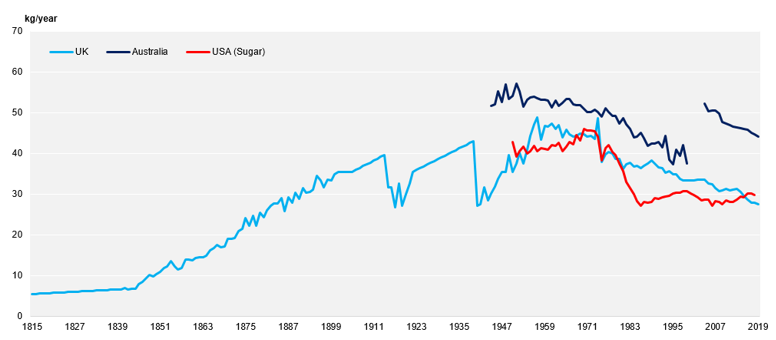
In the USA, sugar consumption has been flat for years21. The fall in the 1970s and 1980s is due to the uptake of corn syrup at the expense of sugar.
American Per Capita Sugar Consumption is Flat
However, overall sweetener use in America is now falling.
American Sweetener Consumption is Falling
Looking at global sugar consumption, it’s clear something changed around the year 2014. We used to think that 2% growth each year was normal, 1% for increasing population and 1% for increasing wealth. Times of high sugar prices would see consumption growth fall to 1%. Low prices would see growth rebound as high as 3%.
Global Sugar Consumption Growth Rates By Year
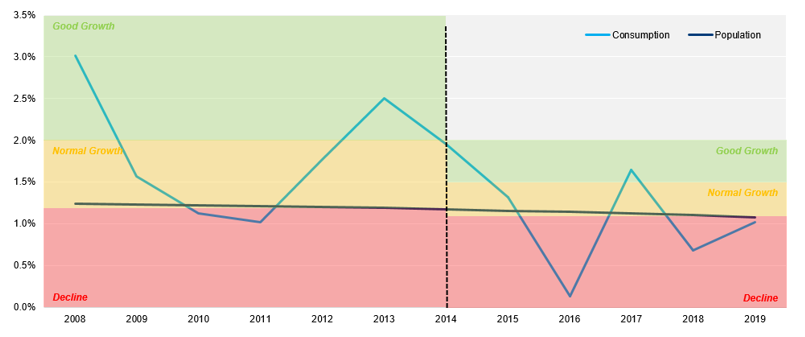
This has now changed. 1.5% is the new normal. We are barely seeing any consumption growth around the world per person.
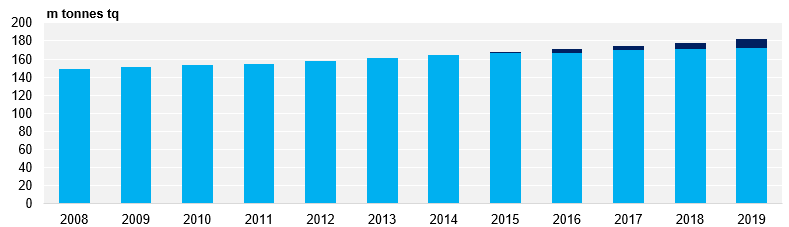
We think people around the world will eat 172.5m tonnes of sugar this year. But if consumption had grown at 1.5% per year since 2014, we’d be at 177m tonnes. If consumption had grown at the old rate of 2% a year since 2014, we’d be at 181.6m tonnes.
The World Has Lost Sugar Consumption Since 2014
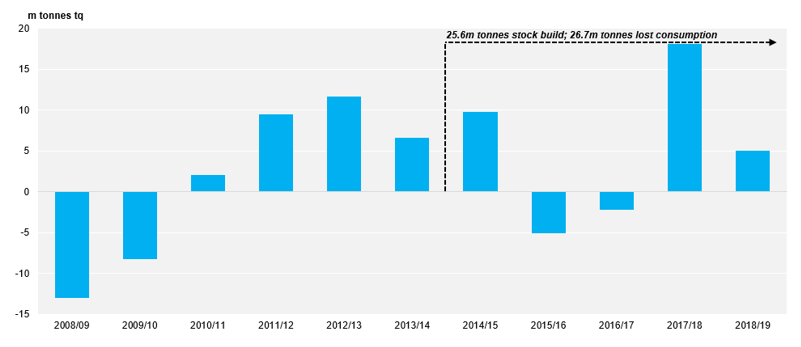
These effects are cumulative. 2% growth since 2014 would wipe out the entire increase in global sugar stocks we’ve seen since that time. World market raw sugar prices in 2014 were around 18c/lb, compared to 12.50c/lb today.
The Cumulative Loss of Sugar Consumption Since 2014 Outweighs the Global Sugar Stock Build Since This Time
Sugar taxes won’t go away. This is something sugar industries around the world will have to adapt to. But it doesn’t mean that the policy of taxing sugar will necessarily lead to the outcomes governments want, unless their aim is solely to raise revenue.
This is the beginning, not the end.
References
1) World Health Organisation (2015), Public Health Product Tax in Hungary: An example of successful intersectoral action using a fiscal tool to promote healthier food choices and raise revenues for public health, available from http://www.euro.who.int/__data/assets/pdf_file/0004/287095/Good-practice-brief-public-health-product-tax-in-hungary.pdf
2) OECD (2017), Obesity Update, available from https://www.oecd.org/els/health-systems/Obesity-Update-2017.pdf
3) Boseley, S (2017), Mexico’s sugar tax leads to fall in consumption for second year running, The Guardian, available from https://www.theguardian.com/society/2017/feb/22/mexico-sugar-tax-lower-consumption-second-year-running
4) Institute for Health Metrics and Evaluation (2019), available from http://www.healthdata.org/mexico
5) Colchero M et al (2017), In Mexico, Evidence Of Sustained Consumer Response Two Years After Implementing A Sugar-Sweetened Beverage Tax, available from https://www.healthaffairs.org/doi/abs/10.1377/hlthaff.2016.1231
6) FoodBev Media (2018), Lessons from Mexico: ‘Our sugar tax hasn’t worked’, says beverage association, available from https://www.foodbev.com/news/lessons-mexico-sugar-tax-hasnt-worked-says-beverage-association/
7) Guthrie, A (2016), Mexico urged to double tax on sugary drinks, The Financial Times, available from https://www.ft.com/content/e4f36a0e-6485-11e6-8310-ecf0bddad227
8) Scott-Thomas, C (2013), Denmark to scrap decades-old soft drink tax, FoodNavigator.com, available from https://www.foodnavigator.com/Article/2013/04/25/Denmark-to-scrap-decades-old-soft-drink-tax#
9) Arthur, R et al (2018), Sugar taxes: The global picture, FoodNavigator.com, available from https://www.foodnavigator-latam.com/Article/2018/12/14/Sugar-taxes-the-global-picture#
10) OECD (2019), OECD Reviews of Public health: Chile A Healthier Tomorrow, available from www.oecd.org/health/health-systems/OECD-Reviews-of-Public-Health-Chile-Assessment-and-recommendations.pdf
11) Nakamura, R et al (2018), Evaluating the 2014 sugar-sweetened beverage tax in Chile: An observational study in urban areas, PLOS Medicine, available from https://journals.plos.org/plosmedicine/article?id=10.1371/journal.pmed.1002596
12) Caro, J et al (2018), Chile’s 2014 sugar-sweetened beverage tax and changes in prices and purchases of sugar-sweetened beverages: An observational study in an urban environment, PLOS
Medicine, available from https://journals.plos.org/plosmedicine/article?id=10.1371/journal.pmed.1002597
13) Public Health England (2019), Sugar reduction: Report on progress between 2015 and 2018, available from https://assets.publishing.service.gov.uk/government/uploads/system/uploads/attachment_data/file/839756/Sugar_reduction_yr2_progress_report.pdf
14) Change.org (2019), available from https://www.change.org/p/barrs-soft-drinks-company-hands-off-our-irn-bru-please-dont-change-the-recipe-by-cutting-sugar-for-sweeteners
15) eBay.com (2019), available from https://www.ebay.co.uk/p/IRN-Bru-Full-Sugar-34g-Original-Old-Recipe-1-X-330ml-Can/21021230866?iid=333323468565&rt=nc
16) A.G. Barr (2019), Interim Report September 2019, available from https://www.agbarr.co.uk/media/506365/Interim-Report-September-2019.pdf
17) A.G. Barr (2019), Old and Unimproved – 1901 Launched, available from https://www.agbarr.co.uk/about-us/news/old-and-unimproved-1901-launched/
18) Public Health England, op. cit.
19) Public Health England (2019), National Child Measurement Programme, available from https://fingertips.phe.org.uk/profile/national-child-measurement-programme
20) Australian Bureau of Statistics/Greenpool Commodities (2012), available from https://greenpoolcommodities.com/news/australian-capita-sugar-consumption-key-figures/
21) US Department of Agriculture (2019), Sugar and Sweeteners Yearbook Tables, available from https://www.ers.usda.gov/data-products/sugar-and-sweeteners-yearbook-tables.aspx