Insight Focus
- The bull market for US soybean oil remains intact, energies as a whole have turned bullish.
- Ukrainian farmers and processers continue producing in the middle of a war economy.
- New market variable is US renewable diesel industry’s demand for feedstock.
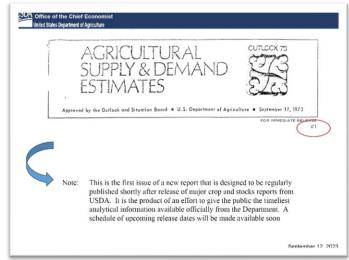
On Tuesday this week the USDA celebrated the 50th anniversary of their World Agricultural Supply and Demand Estimates (WASDE) monthly report which plays such an important role for global traders who use the report’s information to form market opinions and trading strategies. There is no other data source for global grain and oilseed traders that begins to compare. Given the USDA’s enormous resources, thanks to the American taxpayer, the global producer and consumer get an update each month to the major components of global grain and oilseed trade. The below slide appeared in the USDA’s chief economist’s summary of the WASDE report, celebrating the first ever WASDE report (red circle).
The chief economist also added this 50-year comparison table for a look at back then and now.
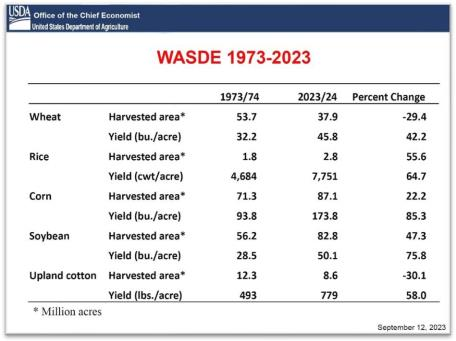
What is striking in the data table is the evolution of the US to a soybean nation driven by a 47.30% increase in soybean acreage during the last 50 years, by far the largest increase of all the major crops. The collapse of the wheat base acreage, -29.40%, and cotton acreage, -30.10%, largely at the expense of the expansion of the corn/soybean rotation culture favoured in the Corn Belt moving into the prairies, South Dakota as the best example, and Deep South, Mississippi as the best example, has changed the face of US agriculture. The advent of the renewable diesel (RD) policy and acceptance by both “Big Ag” and its partner the US farmer and “Big Oil” and its renewable diesel accepting customer mean more of the same to come: more soybean acres via a corn/soybean rotation and less wheat and cotton acres.
********************
What is happening with global vegetable oils and the bull market that I thought was moving into a full stampede? Well, a couple of things: consider this chart below which regular readers know I feature each month when the USDA updates it.
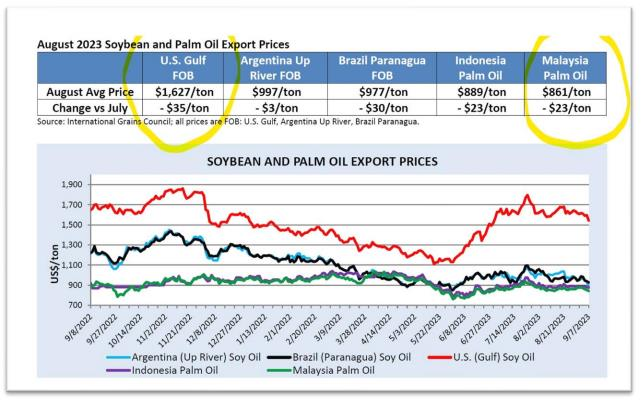
While the chart tells an obvious story, that is US soybean oil prices at nearly two times the price of palm oil at the cheapest origin, Malaysia, there is another element to the global trade that is weighing on prices and the bull market and I have not accounted for it in my bullish outlook.
I mentioned in my most recent podcast with Paul Chapman, my admiration for the Ukrainian farmer who is overcoming enormous challenges to produce crops (and for the labourers and staff at the oilseed processing facilities who are facing tremendous risks themselves to assist their farmer customers in receiving the oilseed production, processing it, and shipping it for domestic or export consumption). As the below supply and demand data table for sunflower seed and products from the USDA’s Oilseeds: World Markets and Trade September 2023 displays, the Ukrainian farmer and Ukrainian processing industry just keep on keeping on in the middle of a war economy. I repeat my thoughts from the podcast: I can only stand in incredible admiration from a peaceful and quiet Omaha, Nebraska for the efforts being made to feed the world (and contain food inflation) from a war-torn Ukraine.
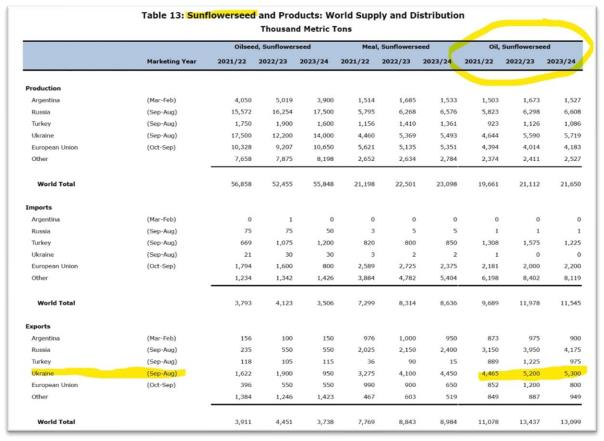
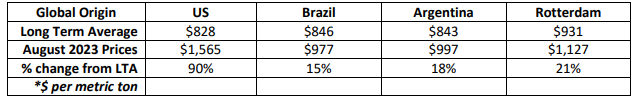
Unfortunately, and I am sure for many more reasons than the obvious – such as an oil tank loaded with sunflower oil sitting at a port is a big risk in the current environment – the Ukrainians and to a certain extent the Russian sunflower processors continue to indiscriminately unload sunflower oil on to world markets. Consider the below USDA matrix and the long-term average prices and price relationships.
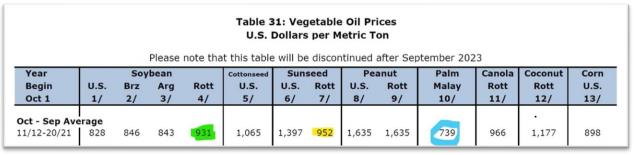
The above matrix historically appeared as the last page of every one of the USDA’s Oilseeds: World Markets and Trade reports and as the note below the title indicates the USDA will discontinue the matrix in future reports (Why? I guess because the prices are available from an open-source USDA database but come on USDA, it is so convenient to have the table in the report! Please reconsider!).
Here are August 2023 prices that the USDA provided relative to the above long term average prices:
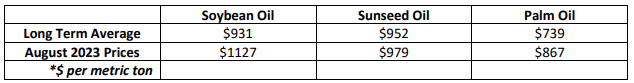
The price series above shows that the historic long term sunseed oil premium to soy and to palm has eroded to a discount for sun to soy and a small premium of a little more than $100 to palm. The trader professionals are rolling their eyes because historically sun can achieve discounts to soy for brief periods when Ukrainian/Russian supply exceeds demand BUT all other times that this occurred did not include a WAR occurring in the middle of the Black Sea which is the global key origin for sunflower oil.
To put it succinctly, I never would have imagined that the Ukrainian farmer/industry could keep going amid a war.
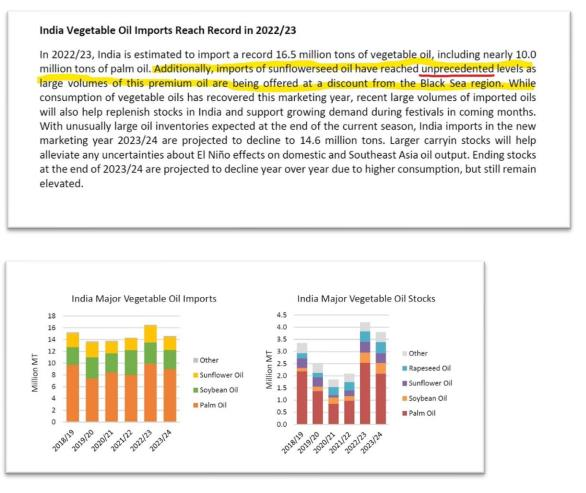
And the beneficiaries are the global consumer; see highlighted notes below on India’s unprecedented sun oil imports also from the USDA’s Oilseeds World Markets and Trade September 2023.
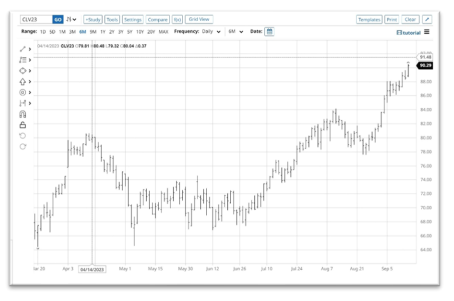
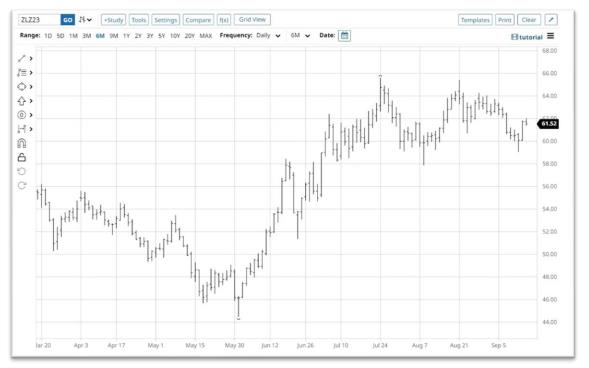
And so, the flat price of the most liquid Chicago Mercantile Exchange (CME) soybean oil futures contract, December 2023, is meandering.
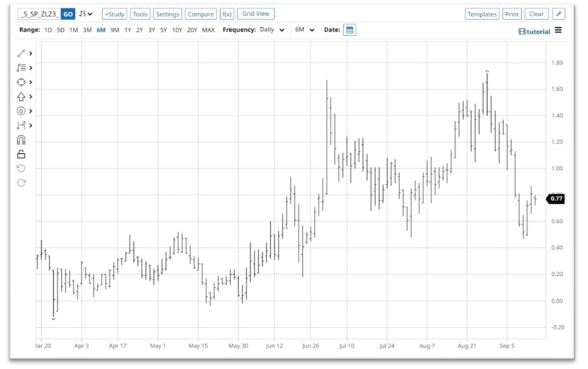
The front part of the CME’s soybean oil futures curve, the December 2023 versus the March 2024, is drooping.
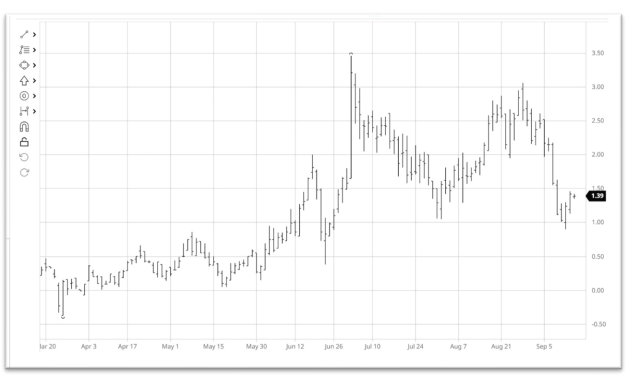
And the middle part of the curve, the December 2023 versus the July 2024, is back at its long-term trend.
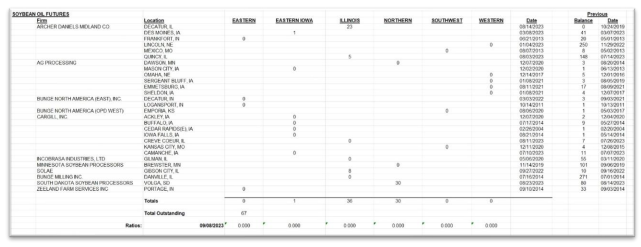
The CME’s delivery window remains nearly empty with 67 open contracts, which likely get ordered out very soon by those who own them, and the physical US soybean oil markets continue to trade well above delivery.
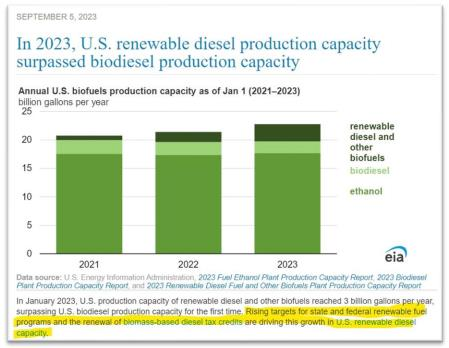
In the bigger and longer-term trading picture for all of us oilseed traders we need to remember that the new market variable which stems from the US renewable diesel industry’s demand for feedstock continues to expand (see the following EIA chart).
Consider the below data table, again sourced from the USDA’s Oilseeds: World Markets and Trade September 2023. The table compares the August 2023 prices for soybean oil offered free on board (FOB) at all the world’s major origins to the USDA’s long term soybean oil price averages with a percentage change comparison from the long-term average. Note the US soybean oil price structural break relative to all the other origins.
The influence of the below on the above is here to stay and it is a growing and not declining influence:
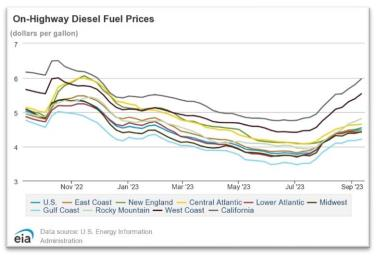
And now another bullish factor has emerged: energies as a whole have turned bullish.
Conclusion:
The vegetable oil bulls were trotting, galloping, and then stampeding earlier this summer but have returned to a trot for now given world supplies of palm and sunflower oil weighing on global vegetable oil prices. US demand for renewable diesel feedstock remains robust and the US petroleum markets are short of supplies (the US strategic petroleum reserve at decades’ low inventory).

The bull market for US soybean oil remains intact and will get a new source of oxygen from the overall bull market developing in a tight petroleum market. Biofuels processing margins will expand rapidly as the change in price of US West Texas Intermediate (WTI) petroleum prices exceeds and outstrips biofuel feedstock prices resulting in expanding feedstock demand.
I anticipate that Q4 2023 and Q1 2024 will feature a recovery from recent weakness and potential moves to challenge previous highs of 2022 (chart on page 2). See October 2023 WTI futures below.