
Insight Focus
- Freight rates continue to fall.
- Many shippers are reluctant to book long-term contracts in case the market drops further.
- Fleet overcapacity will remain in 2023 and 2024.
Overview
Falling demand and increasing supply due to new deliveries and lower congestion continue to dominate the picture. Freight rates continue to fall as they look for their landing spot.
Long-term rates are now also coming down. But many shippers are reluctant to lock themselves in with their typical long-term contracts, wanting to benefit from further market drops.
Record high capacity to be delivered in 2023 and 2024 will far outweigh any effects new environmental regulation will have on the available fleet, painting a picture of overcapacity as demand is not expected to grow in 2023.
Slow global economic growth, the cost of living crisis and the Chinese zero-COVID policy have all contributed to falling volumes. The latter is now being rolled back, but with lower demand in consuming countries, there is little to support strong volume growth next year.
Container Rates
The big question for many as we enter another turbulent year in container shipping is where long-term rates are headed. The question is relevant given their importance to the overall spending in container shipping and the collapse we have seen on the spot market.
Average rates for all valid long-term contracts are coming down, as reflected by the largest month-on-month decline in November’s global XSI® for the contract market.
The index is still considerably higher than it was a year ago. The average rates are still lower than last year on many trades, considering all the newly signed long-term contracts.
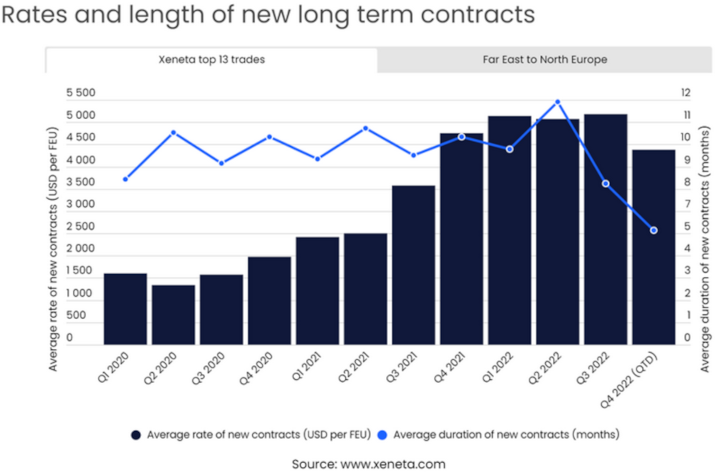
The average long-term rate for contracts starting in Q4 this year on Xeneta’s top 13 trades is down by 7.4% compared to Q4 2021 and lower than any other quarter in 2022.
However, this recent decline still leaves long-term rates considerably higher than what shippers can get on the spot market. This leaves plenty of room for long-term rates to fall further.
Many shippers are well aware of this situation and wondering how to best use it to their advantage. Shippers do not want to miss out on lower freight rates by prematurely signing a contract for the whole of 2023.
For some, the answer to this dilemma is to index-link their contract. Another option is to add trigger points to fixed-rate contracts to ensure they aren’t fully isolated from savings opportunities if the market continues to fall.
Some shippers are choosing to reconsider their tender schedule instead. They are either extending expiring contracts or are moving onto the spot market to wait for long-term rates to be low enough to sign new contracts.
For most large BCOs, relying entirely on the spot market is not an option. They need to transport essential goods under well-known conditions. However, their volumes are so high that it would require huge resources to put them on the spot market.
Xeneta data also reflects a decrease in the average length of new contracts being signed. The decline in contract length is driven by shippers looking for guarantees offered by the long-term market but are keen to profit from lower rates regularly.
In Q4, the average length of new long-term contracts signed on Xeneta’s top 13 trades fell to 5.6 months, exactly half the average length of contracts signed in Q4 2021.
Looking at the Far East to North Europe, the average length of new contracts has fallen to 4.1 months, with 82% of the new contracts in Q4 lasting six months or less. No contracts lasting two years or more have been registered in Q4 this year, while in Q4 2021, about one in five contracts were for two or more years.
The importance of long-term rates to some carriers’ revenues has meant more reluctance to lower rates at the same pace as on the spot market. On the spot market, the key aim has been to secure volumes for some carriers at whatever the price.
Spot rates from the Far East to the US West Coast are now just USD 300 per FEU from where they were in December 2019. As operating costs have increased since then, these levels suggest that the services and carriers most exposed to the spot market are operating below breakeven.
Even with plenty of money in the bank, carriers will likely push for GRI implementation to get spot rates above their new breakeven level as we approach the Chinese New Year.
Though some trades are still sticking out without the same dramatic falls in the spot market, carriers will not be able to keep certain trades so high above others when it comes to profitability. Capacity will chase higher profits, bringing rates on these trades back in line with the rest of the world.
Demand
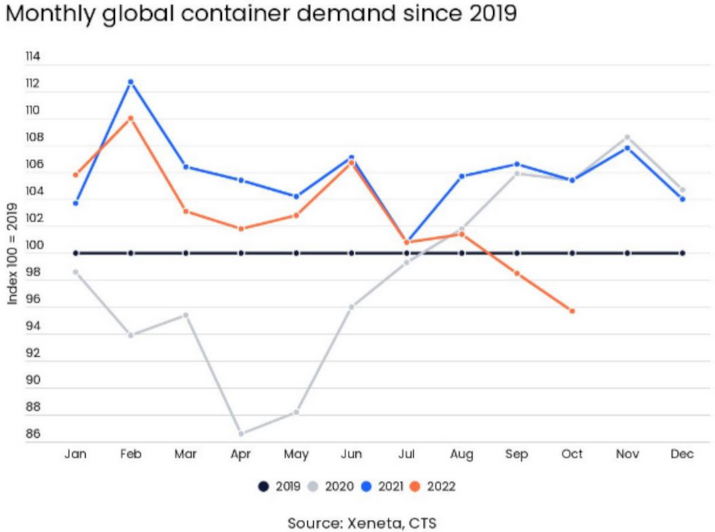
In the first ten months of the year, global container volumes fell by 3.0%, according to Container Trade Statistics (CTS).
Though accumulated volumes have been down year on year since February, the pace of decline has accelerated in recent months.
September and October are the first months in which volumes are lower than in the corresponding month of 2019 since July 2020.
Year-to-date global container volumes are still higher than in 2019, but only by 2.5%.
Even if we do not consider the ups and downs of the past two years, demand growth of only 2.5% over three years is considerably lower than the trend growth experienced before the pandemic.
Real demand for container transportation work is falling faster than volumes would suggest, as the average distance from which containers are moved is also falling.
By splitting global demand into two groups, intra and inter-regional volumes, it is clear how the average haul is falling.
Volumes on the longer distance inter-regional trades have fallen by 4.1% in the first ten months of this year compared to 2021. Compared to 2019, container volumes on these trades are up by a measly 1.0%.
Volumes on intra-regional trades have also fallen this year compared to 2019. But they are down by only 0.7% and, compared to the first nine months of 2019, are up by 5.5%.
Another pain point in the overall demand picture is the faster fall in demand on fronthaul trades (eastbound transpacific -11.9% YTD) than on backhauls (westbound transpacific +0.4% YTD).
In October, volumes on fronthaul trades were down by 920 000 TEU (-13.3%) from October 2021, whereas volumes on backhaul trades were down by 240 000 TEU (-7.8%).
As fronthaul trades dictate the capacity requirements, the fall on these specific trades is more reflective of the transportation demand than the overall drop on all inter-regional trades.
This explains the high levels of blank sailings and outright service cancellations.
With reduced capacity due to lower fronthaul demand, backhaul legs will have a higher load factor than last year, but still not enough to drive higher freight rates.
US Christmas Tree Light Imports
The approaching holiday season offers the opportunity to take a look at a highly seasonal good that reflects the demand dynamics over the past two years and the bringing forward of imports that led to peak season being all but canceled this year.
US imports of Christmas lighting sets are typically heavily concentrated between September and October to allow retailers time to get them onto the shelves.
Last year total imports rose by 10% from 2020, hitting 170.4 million sets of Christmas lights.
But the peak in imports came much later than in a typical season, with almost 40% of imports only arriving in the US during Q4. The delay put enormous time pressure to get these goods into shops in the limited time frame when consumers usually buy.
This year, imports are down by 3.9% in the first ten months of 2019, with imports of these lights peaking in August, and falling steadily since then, as shippers ordered early to avoid the same problems as last year.
On a higher level, total containerized imports to North America have fallen by 2.9% in the first ten months of the year, with imports seeming to have peaked in July and fallen fast since then.
Reefer Rates and Demand
Reefer volumes year to date are down by 1.6%, less than 1m TEU moved in September and October, but not significantly different from last year. There are more nuances than with dry containers as to how demand for trade types is developing.
The biggest trade, intra-Asia, has grown by 1.7%, but so have several of the large long-haul trades.
For example, from South America to the Far East, volumes have risen by 17.3% in the first ten months of the year than in 2021. In contrast, exports from South America to Europe have fallen by 8.3%.
Overall exports of reefer containers from South America have risen by 0.7% from 2021. Also, reefer exports out of Europe have seen a split. Volumes to the Far East have fallen by 12.2%, while those to North America have risen by 3.2%. Freight rates for reefer containers are also falling, though not at the same pace as for dry containers.
From North Europe to the Far East, for example, spot rates are down by 11% from a year ago at USD 4 600 per 40’ reefer.
Long-term rates have, on the other hand, increased by 11% from a year ago and, in fact, rose again in October to USD 4 600 per FEU.
Reefer shippers can expect further falls in spot rates both on the long and the spot market as carriers adjust to their return to having to compete for volumes and with the competition between dry and reefer containers cooling right back down.
Supply
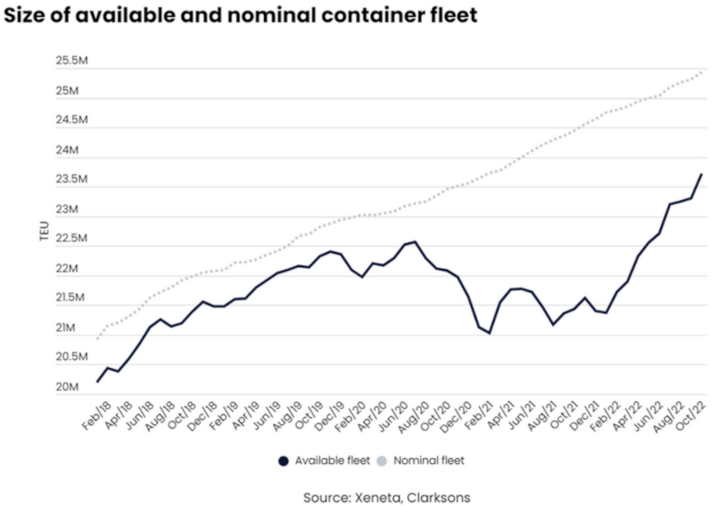
In 2021, the available capacity for most of the year was lower than in 2019 due to the capacity being stuck in congestion.
So, as congestion eases, the available capacity is now rising in 2022. Compared to October 2019, the available capacity is up by 6.2%, whereas in October 2021, it was down by 4.0% from October 2019.
The nominal and available fleets are set to increase as the huge amount of new tonnage ordered since Q4 2020 is delivered at an increasing pace through 2023 and 2024.
Xeneta expects 1.7m TEU to be delivered in 2023 and 2.5m more in 2024, levels which also reflect Xeneta’s expectations for slippage (delaying a delivery) and cancellations.
The record for new containership deliveries was in 2015, when 1.67m TEU was delivered. This record will be threatened in 2023, depending on where slippage and cancellations land.
But 2024 is set to make a new record, which will hold for many years.
With this huge increase in capacity and the outlook of falling demand and low rates, demolition will pick up from its current lackluster state. Two more ships were demolished in October and November.
This brought the grand total of ships demolished in the first eleven months of 2022 to 4, totaling 3 020 TEU. In total, during 2021 and 2022, as little as 15 000 TEU has been demolished, less than a tenth of what left the market in 2020 (187 500 TEU).
In 2023 we expect demolition to increase to 400 000 TEU, a level last seen in 2017. Driven by deteriorating market conditions, held back from its full potential due to many demolition candidates being out on charter.
Looking into the next two years, we have set up three scenarios for the development of the available fleet. This is considering new deliveries, expected demolition activity, congestion and fleet efficiency.
What Does This Mean for Available Capacity?
Scenario 1: Return to the pre-pandemic. Congestion eases gradually as we return to the pre-pandemic norm of 3% with no effect from new environmental regulations.
Scenario 2: Easing congestion and lower fleet efficiency. Congestion eases slightly, but as congestion eases, the impact of new environmental regulation hits the efficiency of the fleet, with the two factors combined removing the equivalent of 7.5% of the nominal fleet from the available fleet.
Scenario 3: Congestion and regulation remove a large share of the fleet. Congestion stays where it is today, but the new regulation has a larger and faster impact than in scenario 2, increasing the share of the ‘unavailable’ fleet to 12.5% from the start of 2023.
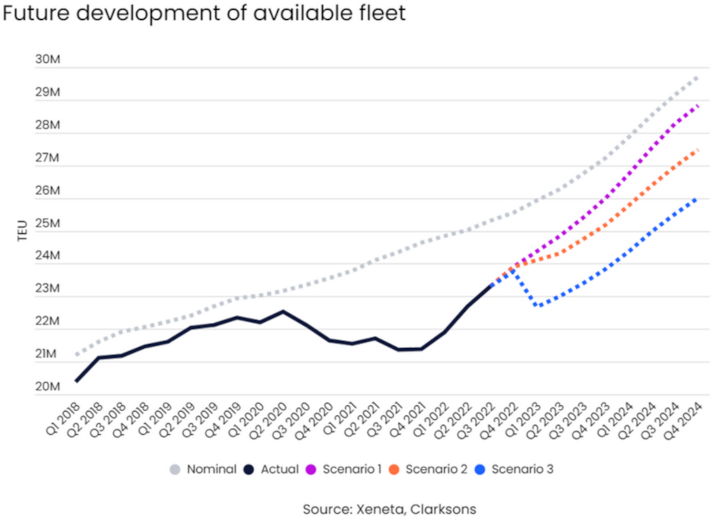
Even in the “worst situation” in Scenario 3, the available fleet will grow after the initial bump from new regulations.
While growth will be lower than in return to the pre-pandemic scenario, it will still be higher than expected demand growth.
This suggests that overcapacity will put a tight limit on carriers’ revenue in 2023 and 2024.
Macro
These days a lot of focus is rightly placed on developments in China and the recent easing of its zero-COVID policies after protests, including the existing damage to the economy.
The IMF expects the Chinese economy to grow at its slowest pace in around three decades this year.
In the first three quarters of the year, the Chinese economy grew by 3.0% from 2021 (Source: National Bureau of Statistics China). It’s unlikely to be any better in Q4 2022.
The rolling back of the zero-COVID policy will stimulate economic activity and reduce uncertainty, although this is likely to be held back should the case numbers spiral.
Internally, domestic consumption is down year-on-year, taking a hit from lower consumer confidence.
In October, retail sales of consumer goods fell by 0.5% year-on-year, and retail sales have grown by just 0.6% year-to-date. In 2021 Chinese retail sales rose by 12.5%.
This development is having a big impact on intra-Asian business.
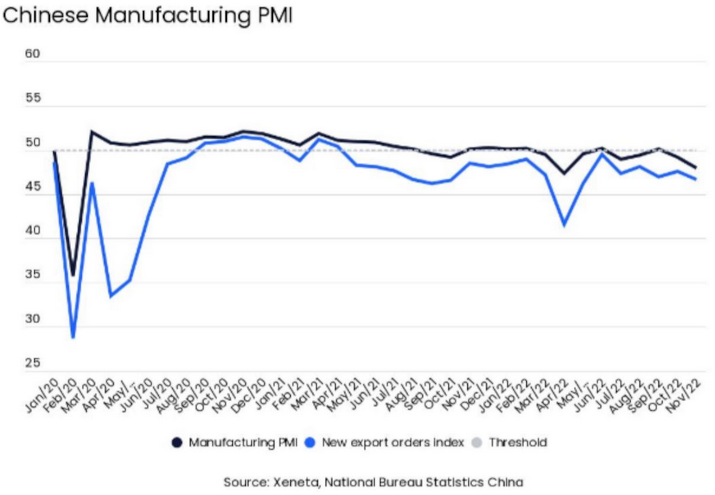
For international container and air freight shipping, the impact on Chinese manufacturing and export activity is important.
China’s PMI fell to 48.0 in November, where anything below 50 indicates a month-on-month contraction.
Though this is only the second month in a row of a contraction, the index has been below 50 in nine of the past 15 months and even when it has been above 50, growth has been very muted.
The last time the Chinese manufacturing index was 51 or higher was in May 2021.
The new export order index, a sub-index of the manufacturing PMI, paints an even more dire picture.
This sub-index has been declining month-on-month for the past 19 months, digging itself into an ever deeper hole.
The result of this slowdown in manufacturing and new export orders can be clearly seen in Chinese exports, despite the yen devaluation, which should stimulate export demand.
In October, the value of Chinese exports, measured in USD, fell by 0.3% from a year before, a fall which would be even higher were it not for the high inflation rates over the past year.
On the flip side, the question is whether this fall in exports from China is bigger than the fall in demand from major consuming nations as their economies struggle with the higher cost of living and slowing growth.
Consumer demand in major consuming regions, the main driver for containerized imports, has stalled when adjusting for inflation. In the EU, the retail trade volume in October was 2.2% lower than in October 2021, despite the value of retail turnover increasing by 6.3% over the same time.
In the US retail sales, total retail sales have grown by 8.9% when measured in value in the first ten months of the year, leaving them almost a mind-blowing third higher than in 2019.
But, the still strong growth in US retail sales is having a much smaller effect on containerized imports than the figure would suggest.
Source: Xeneta, US Census Bureau
This is due to inflation, as fewer goods are needed to generate the same value of retail sales. Also, it can be connected to a shift in retail spending away from goods, typically imported containers, in favor of food and energy products.
In the first ten months of the year, sales at food, beverage and gasoline stores have risen by 18.3%, with sales of other retail goods only rising by 7.3%, in line with inflation.
The high inflation will also have longer-term effects.
The earnings cannot keep up with the increased cost of living, dampening demand and slowing the recovery.
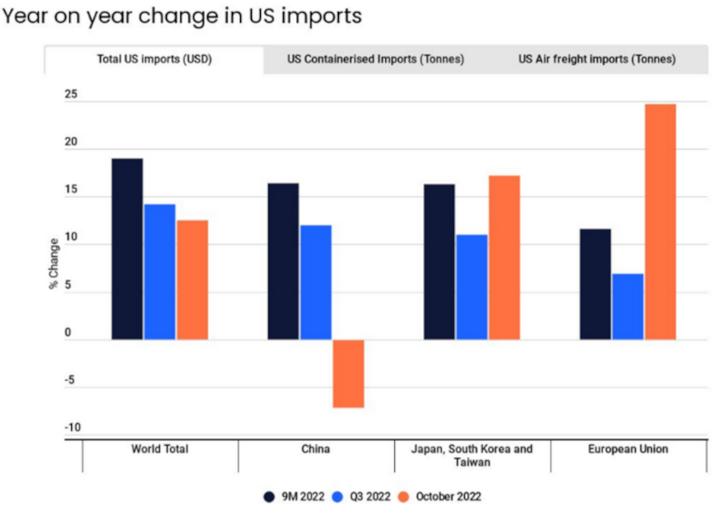
All in all, the value of US imports is still increasing year-on-year.
But the pace of the increase has declined, and the value of imports from China has outright fallen compared to October 2021.
This contrasts with the higher growth of imports from the EU, Japan, South Korea and Taiwan in October.
This shows that the fall in Chinese exports cannot be attributed to lower demand but to disruptions within China.
Looking only at imported containers, the growth rate for total imports is much lower, no longer buoyed by the effects of inflation).
But here, too, China sticks out by delivering a year-on-year fall in volumes. Imports worldwide are up by 2.2% in October from last year, whereas imports from China are down by 13.4%.
The recent easing of restrictions in China suggests exports in December and the New Year will pick up, though likely only after a further fall in November. The early Chinese New Year, on 22 January, will likely also see more travel than in the past two years.
This will impact production as workers return home, often for extended breaks.
Shippers are already looking ahead to ensure a supply of goods through this Chinese holiday, with carriers pinning their hopes on boosting spot rates.