| Settlement (cUS$/lb) | Open | High | Low | Last | Volume | O/I | Life High | Life Low | |||
|---|---|---|---|---|---|---|---|---|---|---|---|
| Date | Spread | Date | Spread |
|---|---|---|---|
| Mar27 / May27 | 0.55 | Oct27 / Mar28 | -0.34 |
| Mar27 / Jul27 | 0.93 | Oct27 / May28 | 0.66 |
| Mar27 / Oct27 | 0.96 | Mar28 / May28 | 1.00 |
| Mar27 / Mar28 | 0.62 | Mar28 / Jul28 | 1.50 |
| May27 / Jul27 | 0.38 | May28 / Jul28 | 0.50 |
| May27 / Oct27 | 0.41 | May28 / Oct28 | 0.54 |
| Jul27 / Oct27 | 0.03 | Jul28 / Oct28 | 0.04 |
| Jul27 / Mar28 | -0.31 | Jul28 / Mar29 | -0.37 |
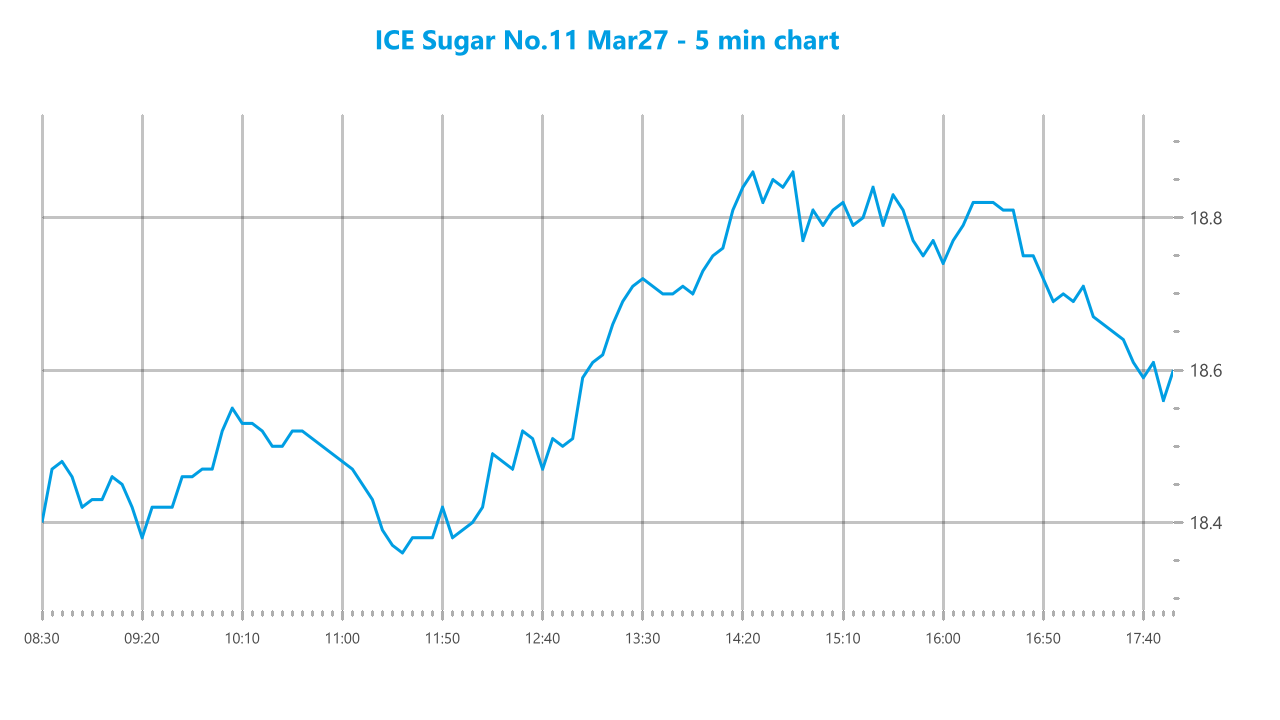
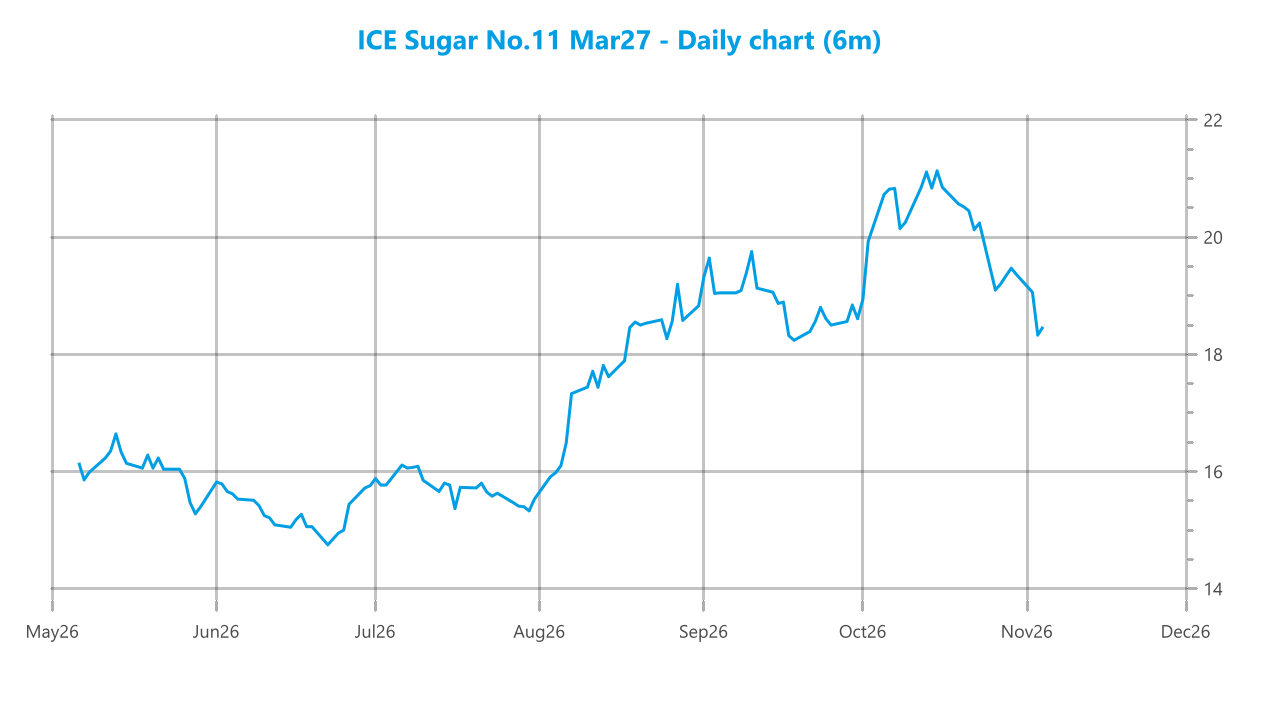
The market slipped back a little during early trading, though found support continuing in the mid 18.30’s from scale buyers to ensure that no new lows for the current decline were recorded. Activity remained slow and mixed through the morning with a revisit to the lows against small trader movements and another slow and uneventful session appeared likely. A little more interest developed during the early afternoon which prompted a few specs to add some weight to the buy side, and having broken to fresh daily ground this carried the market back up at a decent pace to reach the 18.70’s. Another push followed soon afterwards, and highs were recorded at 18.88, however by this stage some light pricing was starting to arrive on the short side which in turn discouraged longs from additional buying. Despite holding the upper levels for a couple of hours we eventually saw smaller traders kicking long positions back out, reducing the gains and leaving March’27 to the centre of the range as the close arrived. Settlement was made at 18.56 leaving another moderate gain in place though the feeling remains that the market is simply in a consolidation pattern for the near term as longs look to stem the decline.
| Settlement (US$/mt) | Open | High | Low | Last | Volume | O/I | Life High | Life Low | |||
|---|---|---|---|---|---|---|---|---|---|---|---|
| Date | Spread | Date | Spread |
|---|---|---|---|
| Dec26 / Mar27 | -18.30 | Mar27 / May27 | -4.90 |
| Dec26 / May27 | -23.20 | May27 / Aug27 | 4.60 |
| Dec26 / Aug27 | -18.60 | Aug27 / Oct27 | 5.60 |
| Dec26 / Oct27 | -13.00 | Oct27 / Dec27 | 3.80 |
| Date | Premium | Date | Premium |
|---|---|---|---|
| Mar27 / Mar27 | 109.02 | Jul28 / Aug28 | 126.36 |
| May27 / May27 | 126.05 | Oct28 / Oct28 | 118.84 |
| Jul27 / Aug27 | 129.83 | Mar29 / Mar29 | 108.50 |
| Oct27 / Oct27 | 124.89 | May29 / May29 | 114.32 |
| Mar28 / Mar28 | 111.29 | Jul29 / Aug29 | 115.95 |
| May28 / May28 | 125.24 |
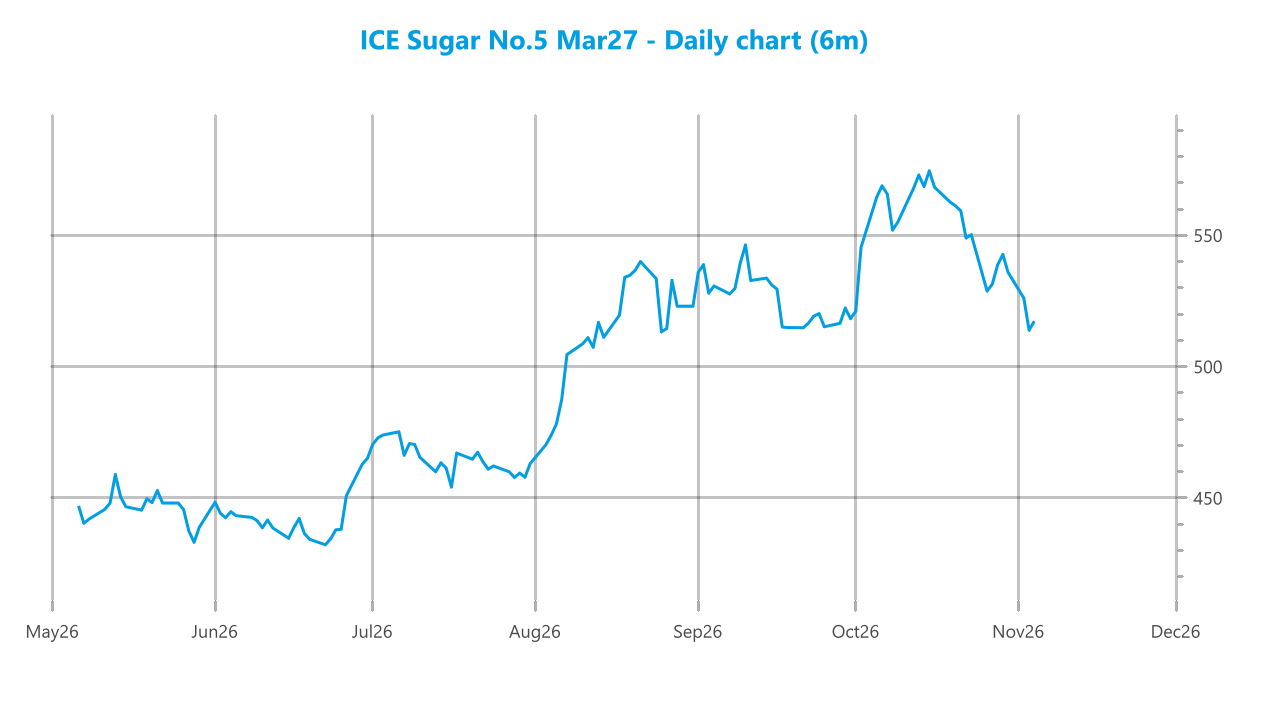
Recent sharp losses have understandably killed confidence amongst longs, and the market was lacking impetus from either side as a slow morning period developed with March’27 contained within a $512.70 / $518.60 band. It was only the arrival of US specs influencing No.11 which drew some fresh buying to markets into the afternoon and this set the market off in search of gains, though on steady progress the $520.00 area proved tough to surpass as we stalled below the daily chart gap. With white premium values having slipped another push followed, and this time we moved with greater pace and moved sufficiently to fill the gap to $524.80 and tidy the chart. Once achieved progress again became trickier, and though efforts continued from specs for a period the price topped at $526.30 and eventually retreated when long liquidation kicked in during the later stages. This left March’27 sitting to the centre of the range at $518.20, while against diminishing roll activity Dec’26/March’27 posted a slightly higher finish at -$18.30.