A Quick Recap
In the first report, we noted that two end products that come from the rolling process are aluminium foils and cans, both of which account for 18% of all aluminium production. We also highlighted that an important perk to using aluminium is its high suitability to recycling. This piece focusses on this and compares its carbon footprint to that of aluminium alternatives (notably plastics).
Aluminium’s Carbon Footprint
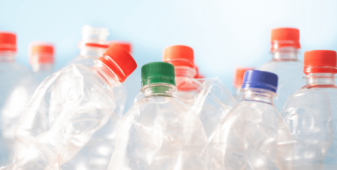
For almost all consumers, when asked which is better for the environment, an aluminium can or a plastic bottle, the answer is the can.
This is because most consumers, when asked the above question probably, imagine something that looks like the image below.
But is it really accurate? In truth, it really depends, but we will demystify this extremely complicated world of environmental pollution and energy balances here as it is important for any company involved in marketing canned products (or foil trays) to have some knowledge of these matters.
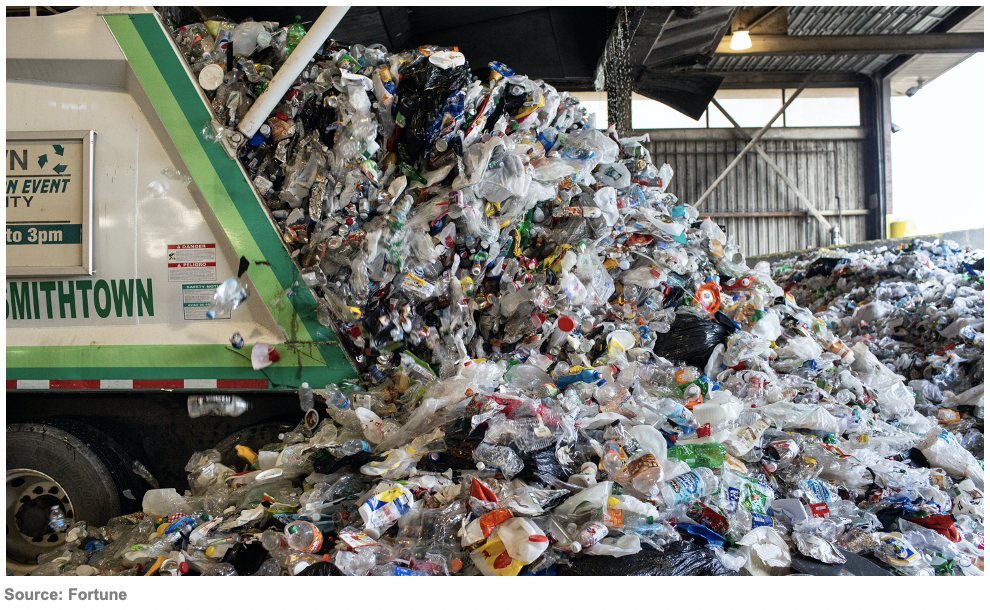
The environmental pollution from plastic waste is worsening and often at the forefront of the media. Contrastively, cans are deemed to be the green alternative, as the label shows they are recyclable. Aluminium supporters and trade organisations have very effectively presented this argument and have been somewhat accidentally bolstered by the environmental movement.
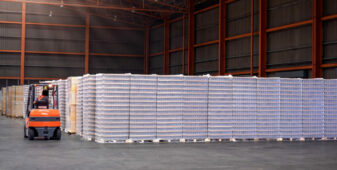
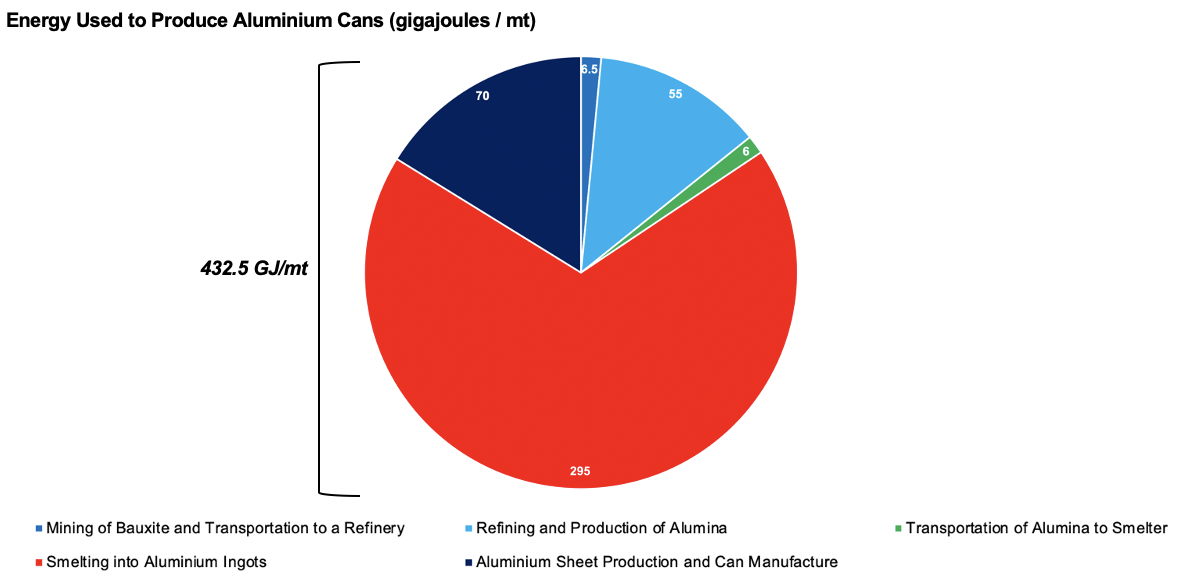
However, it takes a great deal of energy (electricity) to produce aluminium by way of the conventional smelting process and there are other energy components as well.
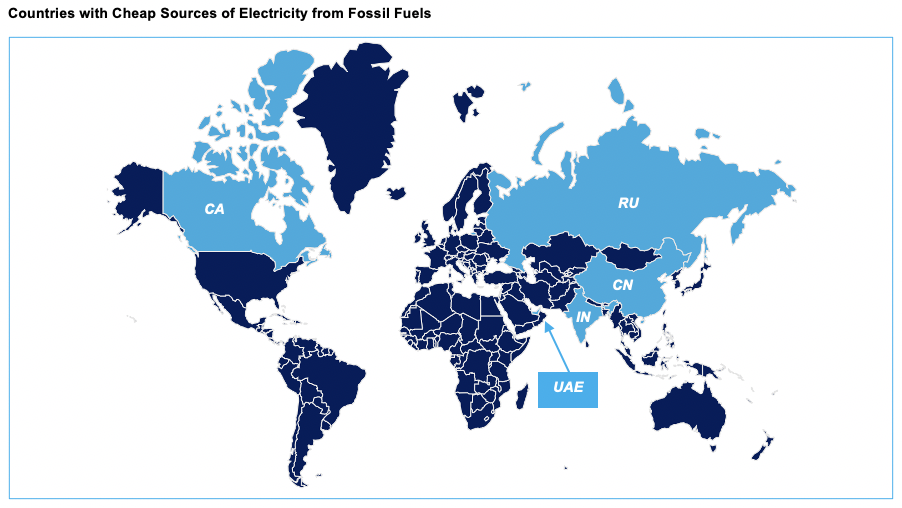
This is why aluminium is produced in countries that have cheap sources of electricity from fossil fuels, such as China, Russia, Canada, India and the United Arab Emirates.
All these factors must be considered when calculating the carbon footprint of an aluminium can, meaning aluminium actually scores quite poorly compared to the alternative of a PET bottle (Polyethylene Terephthalate), especially in low recycling systems using fossil fuels as the energy source.
However, aluminium, in theory, is 100% recyclable and can be recycled multiple times. Up to 15% of the input material is lost as dross (an ash-like oxide currently used for filler in the building industry), but this figure can be reduced to 1-3% by using an aluminium stack melter. The energy used to recycle the aluminium is about 5% of that used from bauxite ore production.
The carbon footprint of PET recycling can also be calculated, and this gives a very different narrative.
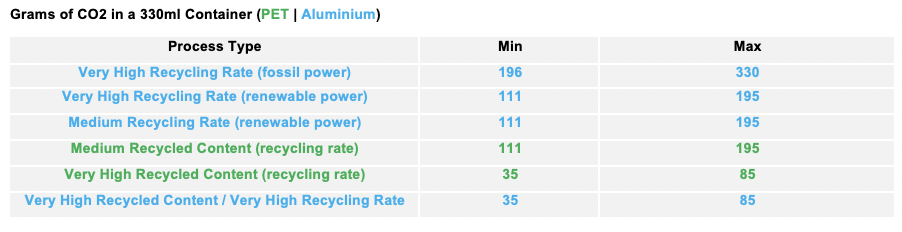
Once renewable power sources and high recycling rates are taken into account, aluminium can match or beat PET on its carbon footprint.
How Much is Recycled Based on Other Constraints?
The story doesn’t quite end there, however. A final consideration is how much is recycled based on other constraints such as cost, logistics and the availability of recycling materials in volume.
The US Environmental Protection Agency (EPA) estimates that cans have 68% recycled content on average, compared to just 3% for plastic. In some situations, the aluminium recycling rate is around 80%. So, for now, aluminium cans have the realistic and practical green edge, if using the best methods, but this won’t see an immediate switch over from plastics.
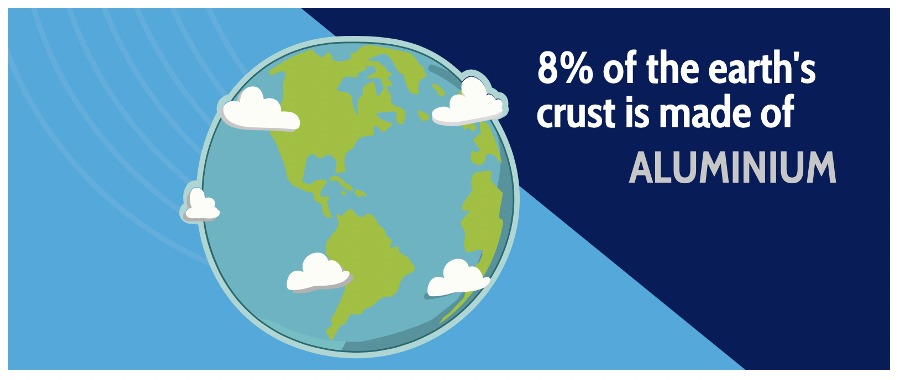
Aluminium is the most abundant element in the earth’s crust; 8.23% by mass and 1.59% of the mass of the entire world. So, there is plenty of it to go around.
However, it doesn’t mean that the right type of environmentally and sensitively produced aluminium can reach the market in sufficient enough quantities to meet demand. This especially applies to the can industry.
According to Ball Corp, the largest global producer of aluminium cans with a current capacity of 105 billion cans, if only 1% of global soft drinks, beer and bottled water switched from plastic and glass to cans, demand would surge by 24 billion cans. Ball Corp, a leading supplier to Coke and Pepsi, is looking to add 4-5 billion cans more capacity by mid-2021, but on these figures, there is a danger of supply outstripping demand.
The amount of plastic recycling is also likely to grow.
In 2017, China banned imports of almost all residential waste including plastics for recycling and burning (about half of world supply). Plastic imports dropped from 581k tonnes in Feb’19 to a mere 23.9k tonnes in Feb’18. This put a major squeeze on countries that had previously used this disposal route, most notably, Japan, the US, Germany, Thailand and the UK.
Although there were some moderate increases in plastic imports from other Asian countries, it was small relative to the Chinese ban. Landfill sites were suddenly under extreme pressure and countries had to adopt other measures, such as taxes and incentives, so more people recycled plastic.
At present, astute beverage packing buyers are keeping their options open and have a foot in both camps; aluminium and plastic.
Coming Up…Consumer Tastes and Preferences
So far, we haven’t focussed on consumer trends and preferences in this series. There are substantial changes in consumer demand for aluminium, both in the foil and can market.
No better example of this is the recent growth in the potable water market, where water is being sold in both cans and resealable aluminium bottles.
And what if, instead of a recyclable can label, it is changed to a low-carbon recyclable label? This will be a topic for later in the series.

Other Opinions You May Be Interested In…