| Settlement (cUS$/lb) | Open | High | Low | Last | Volume | O/I | Life High | Life Low | |||
|---|---|---|---|---|---|---|---|---|---|---|---|
| Date | Spread | Date | Spread |
|---|---|---|---|
| Mar27 / May27 | 0.61 | Oct27 / Mar28 | -0.47 |
| Mar27 / Jul27 | 0.92 | Oct27 / May28 | 0.31 |
| Mar27 / Oct27 | 0.84 | Mar28 / May28 | 0.78 |
| Mar27 / Mar28 | 0.37 | Mar28 / Jul28 | 1.16 |
| May27 / Jul27 | 0.31 | May28 / Jul28 | 0.38 |
| May27 / Oct27 | 0.23 | May28 / Oct28 | 0.38 |
| Jul27 / Oct27 | -0.08 | Jul28 / Oct28 | 0.00 |
| Jul27 / Mar28 | -0.55 | Jul28 / Mar29 | -0.46 |
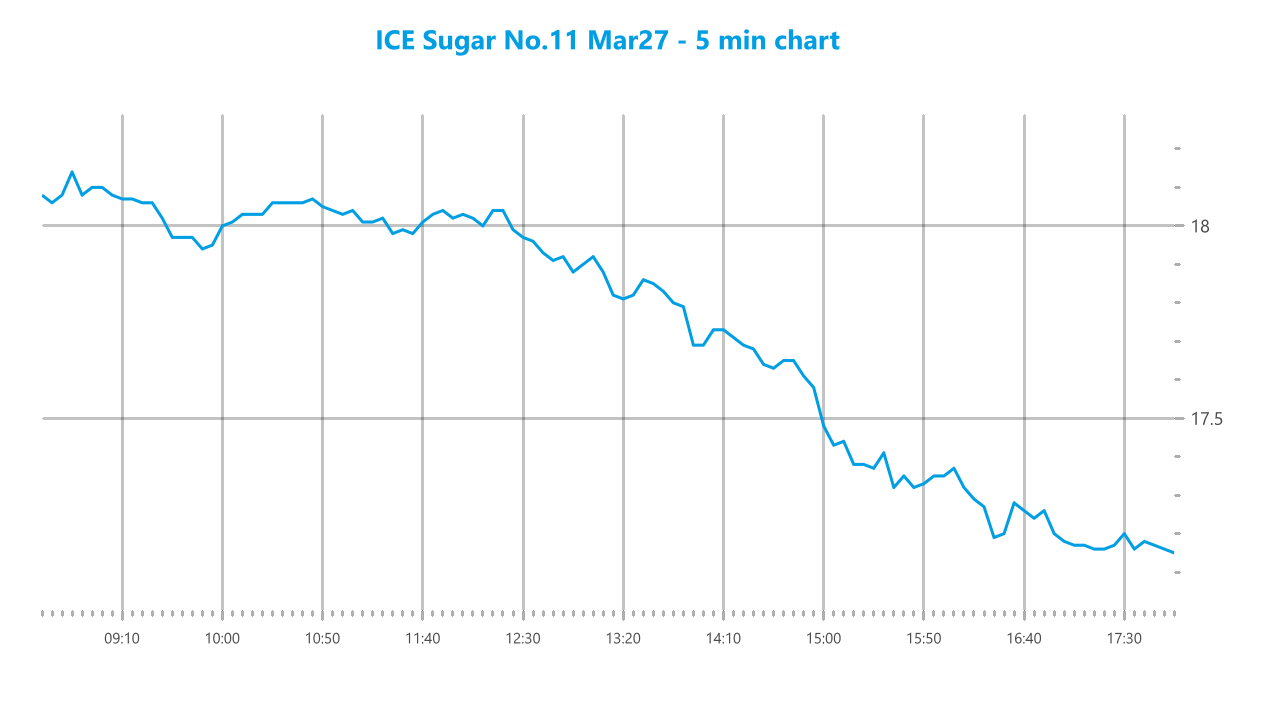
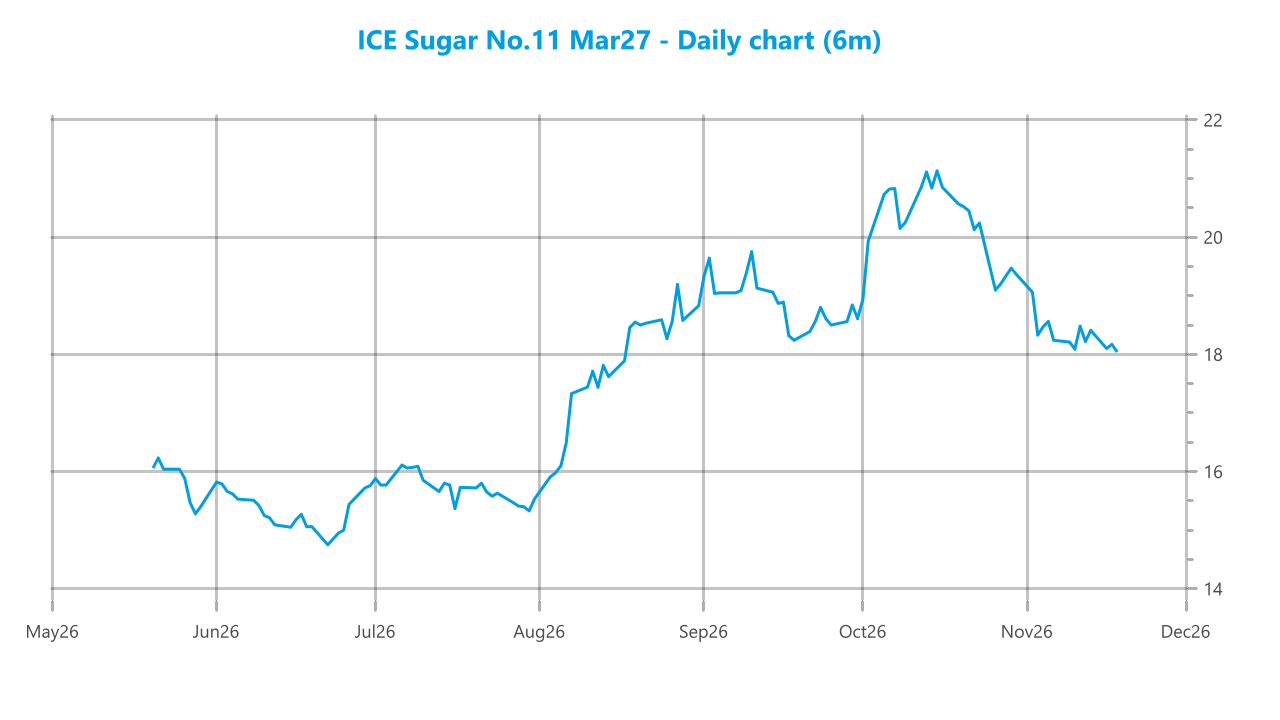
A wild opening saw March’27 swing from 18.10 to 17.90, and while it soon recovered to a high at 18.17 the inference was that the smaller specs are continuing to look to the downside. A slow morning then developed with prices shifting slowly along quietly within the early band, and in the absence of fresh news we awaited the arrival of US traders / funds for the next development. Again, it was the downside which started to receive attention with smaller traders probing towards yesterdays 17.75 low in search of sell stops from fund longs which may generate greater opportunity and trading within a few points of this mark early in the afternoon. Soon after we saw another aggressive push that took the price to 17.68, and though there was not an immediate meltdown due to trade/consumer buying the damage had been down and additional liquidation appeared. Across the following two hours this led the spot to erode all the way to 17.29, reliant on consumer scales and small trader profit taking for support with the chart facing a vacuum. A brief pause in the selling did not encourage any fresh buying / short covering, and so yet more pressure was applied through the latter stages. Lows arrived to 17.13 with the price action remaining around the teens into the call, leaving March’27 to record a technically weak settlement at 17.16 from where we will discover whether much physical interest generates.
| Settlement (US$/mt) | Open | High | Low | Last | Volume | O/I | Life High | Life Low | |||
|---|---|---|---|---|---|---|---|---|---|---|---|
| Date | Spread | Date | Spread |
|---|---|---|---|
| Mar27 / May27 | -1.40 | May27 / Aug27 | 3.50 |
| Mar27 / Aug27 | 2.10 | Aug27 / Oct27 | 2.80 |
| Mar27 / Oct27 | 4.90 | Oct27 / Dec27 | 0.40 |
| Mar27 / Dec27 | 5.30 | Dec27 / Mar28 | -3.60 |
| Date | Premium | Date | Premium |
|---|---|---|---|
| Mar27 / Mar27 | 109.89 | Jul28 / Aug28 | 135.12 |
| May27 / May27 | 124.74 | Oct28 / Oct28 | 131.52 |
| Jul27 / Aug27 | 128.07 | Mar29 / Mar29 | 123.18 |
| Oct27 / Oct27 | 123.51 | May29 / May29 | 129.17 |
| Mar28 / Mar28 | 116.34 | Jul29 / Aug29 | 130.90 |
| May28 / May28 | 130.74 | Oct29 / Oct29 | 125.15 |
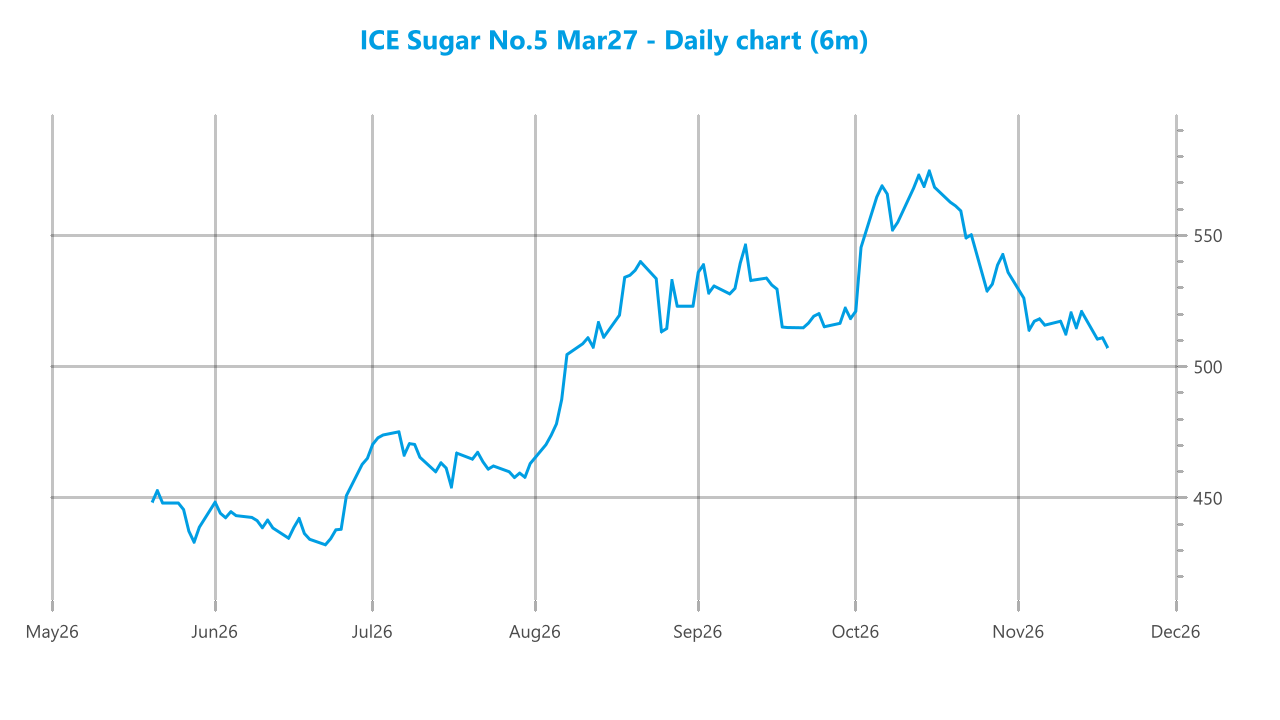
The day started calmly with nearby prompts printing wither side of overnight levels on limited interest. Across the morning the lower end of the range extended to $505.80, and confidence looked to be lacking, however there was no move to test recent lows ahead of $500. This started to change soon after passing through noon with pressure being applied by traders in conjunction with No.11 endeavouring to unseat some of the fund longs sitting in the market. For a period, the fall was gradual and solid buying in the $501.00 area held onto the last elements of support, until a push through $500 around 2pm changed the dynamic and drew out both fresh short selling alongside a degree of liquidation. Across the next two hours March’27 fell to $489.20, facing something of an abyss with the daily chart not signalling any support until the former $477.10 highs. The nature of spot month selling naturally impacted the spread with March/May’27 weakening to -$2.90, though white premiums showed limited change due to similar losses being recorded for No.11. With no obvious support the flat price continued to nudge lower, reaching $486.90 during the final hour. Settlement arrived just a small distance above this mark at $488.20, concluding a weak performance.