ICE Futures U.S. Sugar No.11 Contract
| Settlement (cUS$/lb) | Open | High | Low | Last | Volume | O/I | Life High | Life Low | |||
|---|---|---|---|---|---|---|---|---|---|---|---|
*Volume includes exchange for physicals.
ICE U.S. Sugar No.11 – Spreads
| Date | Spread | Date | Spread |
|---|---|---|---|
| Mar27 / May27 | 0.56 | Oct27 / Mar28 | -0.30 |
| Mar27 / Jul27 | 0.95 | Oct27 / May28 | 0.78 |
| Mar27 / Oct27 | 1.01 | Mar28 / May28 | 1.08 |
| Mar27 / Mar28 | 0.71 | Mar28 / Jul28 | 1.67 |
| May27 / Jul27 | 0.39 | May28 / Jul28 | 0.59 |
| May27 / Oct27 | 0.45 | May28 / Oct28 | 0.70 |
| Jul27 / Oct27 | 0.06 | Jul28 / Oct28 | 0.11 |
| Jul27 / Mar28 | -0.24 | Jul28 / Mar29 | -0.22 |
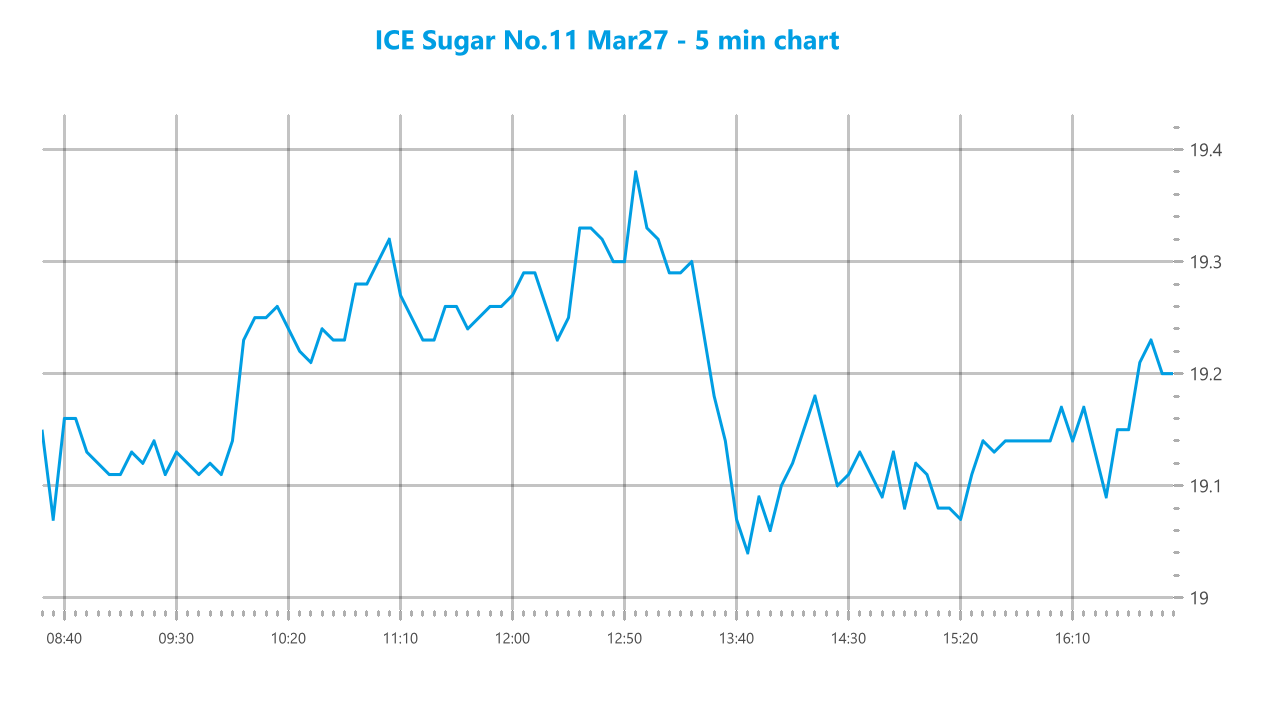
No.11 opened at 19.10 and initially moved lower, briefly testing the session low of 19.03 before recovering. Prices then traded unevenly around the opening area before buying interest strengthened, driving a sharper move higher through the morning. The advance continued in stages, with periods of consolidation and brief pullbacks, eventually taking the market to the session high of 19.42 around the middle of the session. That strength proved difficult to sustain, however, and prices reversed sharply from the highs, with selling pressure accelerating and erasing most of the earlier gains. The market subsequently stabilized above the day’s low and spent much of the later session trading sideways in a relatively narrow range. Toward the close, another recovery attempt developed and briefly gained momentum before easing back. No.11 finished at 19.20, above the opening level but well below the intraday high, leaving the session modestly firmer after a volatile two-way trade.
ICE Europe White Sugar Futures Contract
| Settlement (US$/mt) | Open | High | Low | Last | Volume | O/I | Life High | Life Low | |||
|---|---|---|---|---|---|---|---|---|---|---|---|
*Volume includes exchange for physicals.
ICE Europe White Sugar – Spreads
| Date | Spread | Date | Spread |
|---|---|---|---|
| Dec26 / Mar27 | -12.20 | Mar27 / May27 | -5.00 |
| Dec26 / May27 | -17.20 | May27 / Aug27 | 4.30 |
| Dec26 / Aug27 | -12.90 | Aug27 / Oct27 | 7.10 |
| Dec26 / Oct27 | -5.80 | Oct27 / Dec27 | 5.20 |
White Sugar Premium
| Date | Premium | Date | Premium |
|---|---|---|---|
| Mar27 / Mar27 | 108.11 | Jul28 / Aug28 | 126.08 |
| May27 / May27 | 125.46 | Oct28 / Oct28 | 118.81 |
| Jul27 / Aug27 | 129.76 | Mar29 / Mar29 | 110.83 |
| Oct27 / Oct27 | 123.98 | May29 / May29 | 119.31 |
| Mar28 / Mar28 | 109.07 | Jul29 / Aug29 | 123.95 |
| May28 / May28 | 124.58 |
*Values calculated basis 5:06 PM.
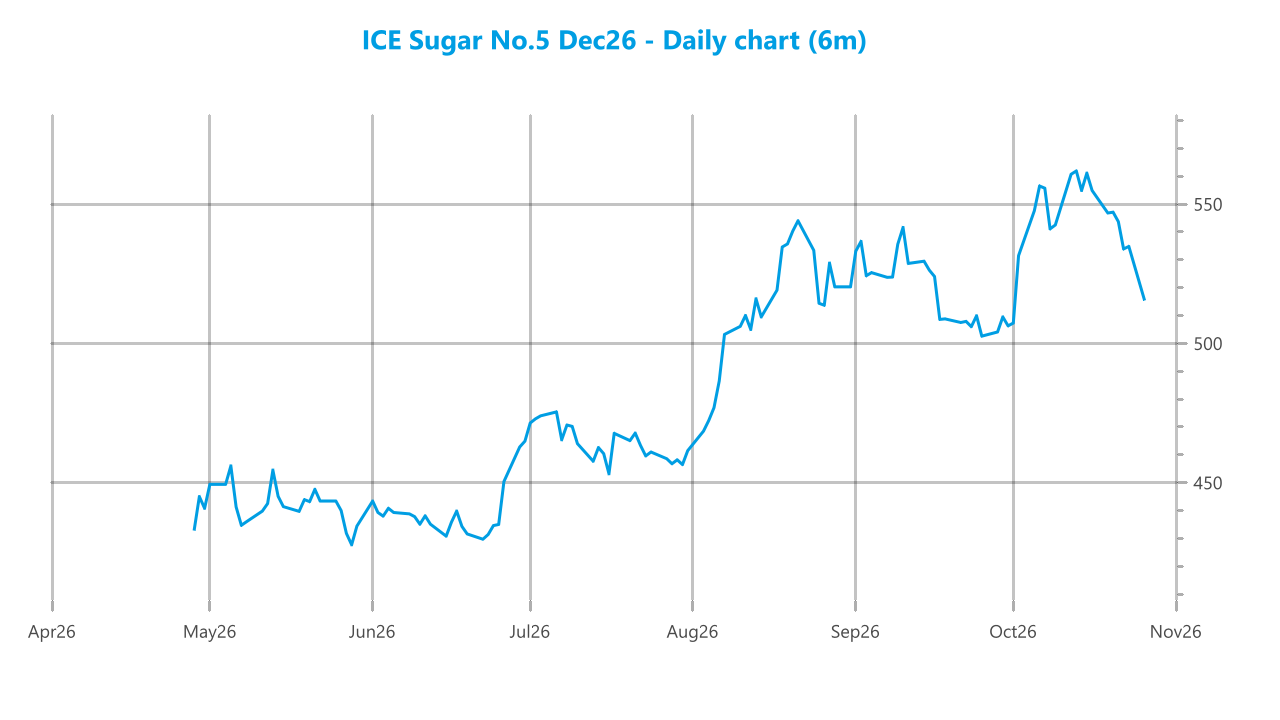
No.5 opened at 517.70 and initially moved lower, with selling pressure pushing prices down through the early morning before support emerged and triggered a sharp recovery. The rebound gathered momentum as the morning progressed, lifting the market above the opening level and into a relatively choppy consolidation at higher prices. No.5 continued to trade firmly into midday, eventually reaching the session high of 523.50, but the rally proved short-lived and was followed by a sharp reversal. Selling accelerated into the early afternoon, taking prices rapidly through the opening level and down to the session low of 513.80. Support appeared around the lows, allowing the market to recover gradually through the remainder of the afternoon, although the rebound was uneven and included another brief pullback. Renewed buying interest late in the session then pushed prices higher again, with No.5 closing at 519.20, above the opening level despite the pronounced intraday volatility.