Insight Focus
- EU PET resin imports post record year even with ADD investigation against Chinese resin.
- US bottle-grade PET imports eased in Q4’23; Taiwan resin continues to grow market share.
- Indian bottle-grade PET exports fell to a multi-year low; new ADD review into Chinese supplier.
EU Bottle-Grade PET Resin Market
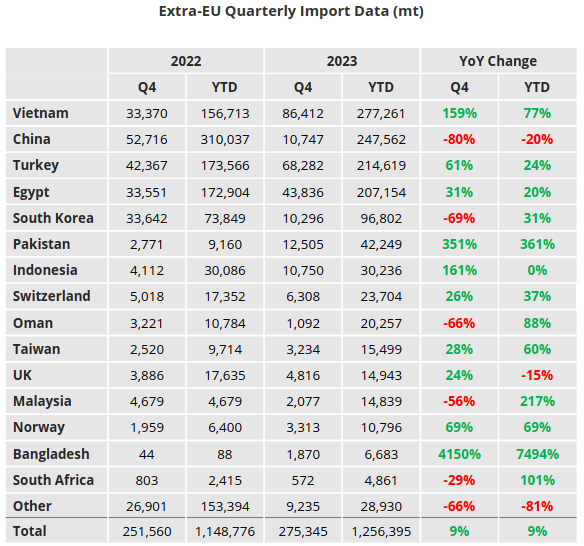
Quarterly Imports
- EU-27 bottle-grade PET imports (HS Code 390761) totalled 275k tonnes in Q4’23, up 12% versus the previous quarter, and closing the year out on a record Q4 high.
- Imports into the EU trade block totalled 1.26 MT for the full-year 2023, surpassing last year’s previous record despite the ADD investigation against China being initiated in March.
- Q4 experienced a wave of imports from Vietnam and Turkey, with quarterly volumes increasing 54% and 48% respectively.
- Imports from Egypt ranked 3rd in terms of volume, although volumes declined by around 5% on the previous quarter.
- Volumes from Pakistan and Indonesia also accelerated, with the EU recording 12.5k tonnes and 10.8k tonnes in Q4’23 from these origins, respectively.
- Whilst Chinese cargoes fell by around half to just 10.7k tonnes in Q4’23, down 80% versus Q4’22.
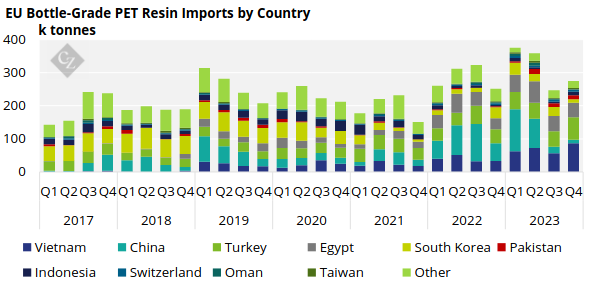
- For Full-Year 2023, the Top-5 origins by volume were ranked, Vietnam (277kt), China (248kt), Turkey (215kt), Egypt (207kt), and South Korea (97kt).
- 2023’s import story was that of a consecutive and rapid decline in Chinese resin imports, replaced largely by duty-free origins.
- Even with the Red Sea crisis hitting mid-Dec, latest import data shows around 110k tonnes of PET resin arrived into the EU in January.
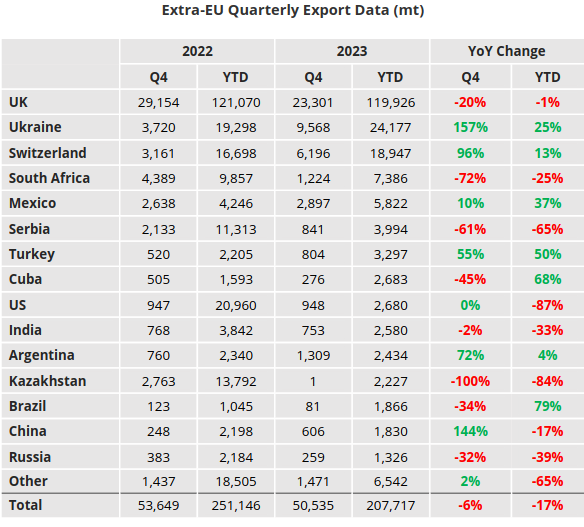
Quarterly Exports
- Extra-regional EU-27 PET resin exports continued to ease slightly in Q4’23, down 7% to around 51k tonnes, as further European production lines were temporally shutdown.
- Whilst volumes to the UK declined 24% in Q4, the UK remained the largest destination for PET resin out of the EU block, with exports (under HS 390761) at around 23k tonnes in Q4’23.
- Quarterly volumes to Ukraine also continued to a slow but steady recovery to 9.6k tonnes in Q4’23, the highest level since Q3’21.
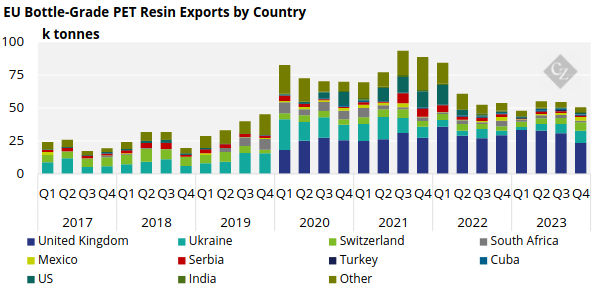
- For the Full-Year 2024, EU countries exported around 207k tonnes of PET resin outside of the EU block.
- The Top-5 destinations by volume were ranked, UK (120kt), Ukraine (24kt), Switzerland (19kt), South Africa (7kt), and Mexico (6kt).
- Ukraine, Switzerland, and Mexico all saw volume gains in 2023, up 25%, 13%, and 37% respectively, whist volumes to the UK eased slightly by 1% for the Full-Year.
US Bottle-Grade PET Resin Market
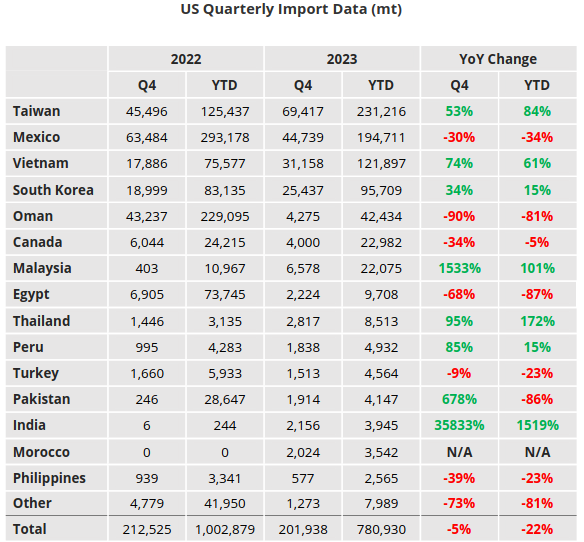
Quarterly Imports
- US bottle-grade PET imports eased into the off-season, totalling 202k tonnes in Q4’23, down 4% on the previous quarter, 5% lower than was seen a year earlier.
- Year-to-date imports were substantially below levels seen the previous year, totalling around 781k tonnes, down 22% over the 12-month period versus 2022.
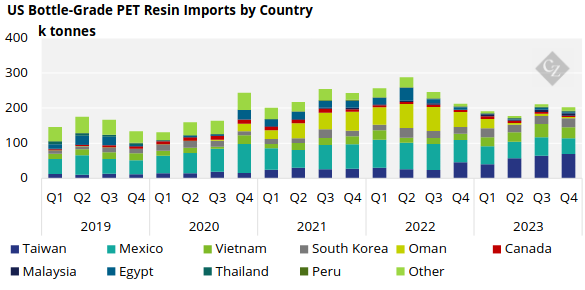
- Taiwan, Mexico, Vietnam, and South Korea consistently ranked as the largest import origins, leading Q4’23 and Full-Year 2023 levels. Combined these origins represented around 85% of total US PET resin imports.
- Taiwanese resin accounted for the largest share of total imports by volume, with 69k tonnes in Q4’23, and 231k tonnes for FY-23, increasing 8% on the previous quarter and leaping 84% for the year.
- Mexico ranked as the second largest origin in Q4 and for FY’23, although volumes slipped through the year.
- Imports from Mexico totalled 44k tonnes in Q4’23, 195k tonnes for the full 12-months, declining 15% and 34% over the respective periods.
- Conversely, imports from Vietnam and South Korea both posted annual increases for 2023, up 61% and 15% versus 2022. Although volumes from Vietnam dipped 17% in Q4’23 in comparison to the previous quarter.
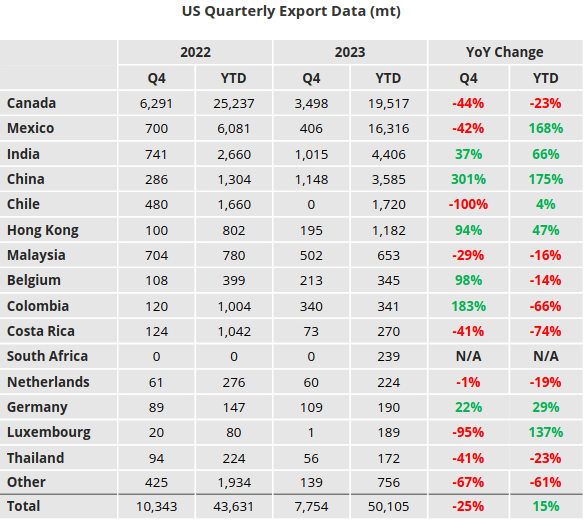
Quarterly Exports
- US bottle-grade PET exports totalled 7.7k tonnes in Q4’23, down a further 18% versus the previous quarter, and 25% below the Q4’22 level.
- Full-Year the US exported just over 50k tonnes of bottle-grade resin, up 15%, largely because of the comparatively large export volume in Q2’23.
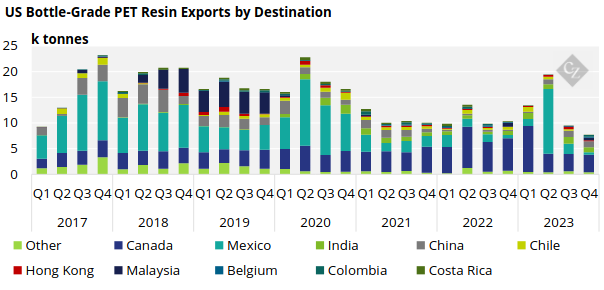
- Canada remained the largest end-destination US PET resin exports, representing 45% of total exports in Q4’23 and 29% of total annual exports.
- Exports to Mexico shrank further to minimal levels of just 406 tonnes in Q4’23, although full-year volumes totalled 16.3k tonnes, 33% total export share.
India Bottle-Grade PET Resin Market
Quarterly Exports
- Indian bottle-grade PET exports fell to a multi-year low in 2023, with exports continuing to slump in Q4’23 to just 57k tonnes; 327k tonnes for the full-year, down 32% and 40% respectively.
- A combination of a tighter domestic market earlier in the year, and challenges competing with lower priced Chinese resin into core foreign markets limited export volumes in 2023.
- Low Chinese producer margins and recent disruption caused by the Red Sea shipping crisis has added to the pressure on Indian exports going into 2024.
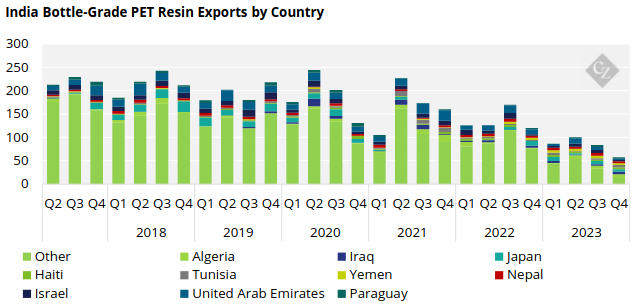
- Algeria was the largest destination for Indian exports with 5.7k tonnes in Q4’23, although full-year volumes to Algeria declined by nearly half in 2023, compared to the previous year.
- Q4’23 also saw Iraq and Japan rank 2nd and 3rd respectively in terms of quarterly volume, both exceeding 5k tonnes.
- Looking at the full 12-month period, the Top Indian export destinations ranked as follows: Saudi Arabia (26.9kt), UAE (25 kt), Japan (23.6kt), Algeria (23.6kt), and Yemen (20kt).
- Exports to Japan experienced some of the strongest annual growth, increasing 46% versus 2022. However, 2024 volumes are still up to less than half of pre-COVID levels.
- Loss of EU GSP status also decimated Indian exports to countries within the EU block.
- In 2022, Italy had ranked as the largest export destination for Indian PET resin with over 56k tonnes, in 2023 volumes under the HS code 390761 had fallen to just 1.5k tonnes.
Quarterly Imports
- Indian bottle-grade PET imports continued to increase in Q4’23, up a further 16.5% on the previous quarter, totalling 56.6k tonnes, 190% above levels seen a year earlier.
- For Full-Year 2023, India imported over 173k tonnes on PET resin, 58% of which originated from China, a large proportion of which is attributed to a single Chinese producer on a lower comparative tariff.
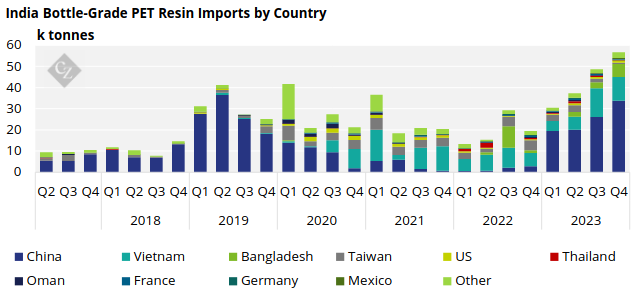
- Despite anti-dumping duties (ADD) on PET resin imports from China for five years from 27 March 2021, imports of Chinese resin surged in 2023, up over 1500%, close to 100k tonnes.
- As a result, in early March, the Indian government announced an anti-dumping review into exports of PET bottle-grade resin from the Chinese producer, Wankai New Materials.
- Although imports from Vietnam dipped in Q4’23, down 17% on Q3’23, annual volumes exceeded 35.5k tonnes, 23% up on the previous year.
- Imports from Bangladesh, which had petered out since an initial surge in Q3’22, also increased, in Q4’23 up 20% on the previous quarter to 6k tonnes, 11k tonnes for the full year.
Data Appendix