

Insight Focus
- Chinese PET exports soared in November as market bottom triggered fresh demand.
- New PET flows from Bangladesh move into Indian market.
- Brazilian PET trade flows normalised to pre-COVID levels; Chinese imports slashed.
China’s Bottle-Grade PET Resin Market
Monthly Exports
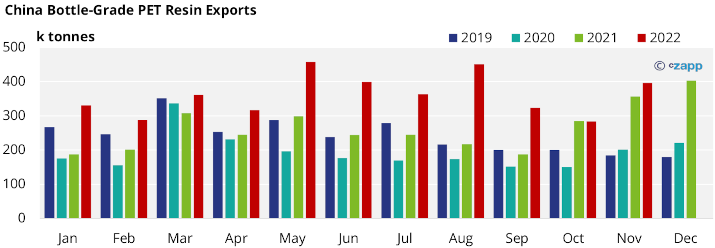
- Chinese Customs reported bottle-grade PET exports of over 395k tonnes (HS 39076110) in November, a massive 40% increase on the previous month, and 11% higher than was seen a year earlier.
- The rebound in November was in part due lower prices triggering improved PET resin sales, as well as previously delayed shipments, and additional bulk orders by large European buyers.
- We expect December exports to remain strong, with reports of tighter availability of material. However, the upcoming Chinese Spring Festival and COVID infections will impact January levels.
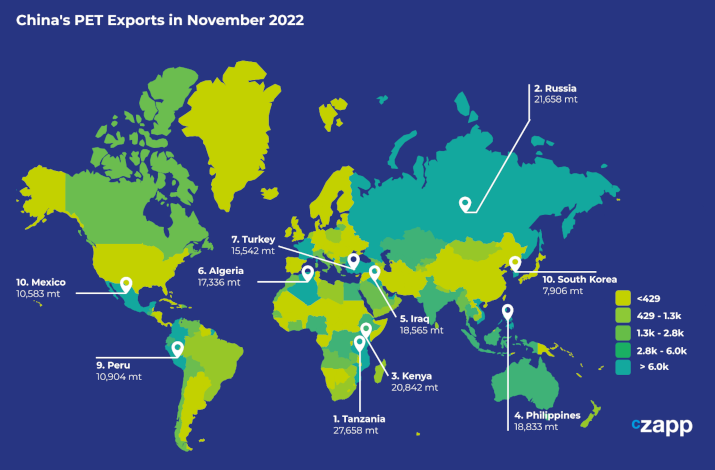
- Tanzania was the largest destination for Chinese PET resin exports in November with over 27.7k tonnes, up over 800% from the previous month.
- Large swings in monthly volumes across East Africa over the last 2 years have been the result of new bulk services, and a move away from containers.
- Exports to Russia, a major traditional sink for Chinese PET resin, came in second, with a 74% monthly increase to 21.7k tonnes in November. Year-to-date volumes to Russia are up 15% versus 2021 volumes.
Source: China Customs Data
- PET resin flows to other African destinations, including Algeria and Kenya also rose sharply. Kenya was the third largest destination, just behind Russia, with 20.8k tonnes, whilst volumes to Algeria leapt 216% to 17.3k tonnes.
- Other destinations of note, experiencing large monthly increases, included the Philippines, Iraq, and Turkey.
India Bottle-Grade PET Resin Market
Quarterly Exports
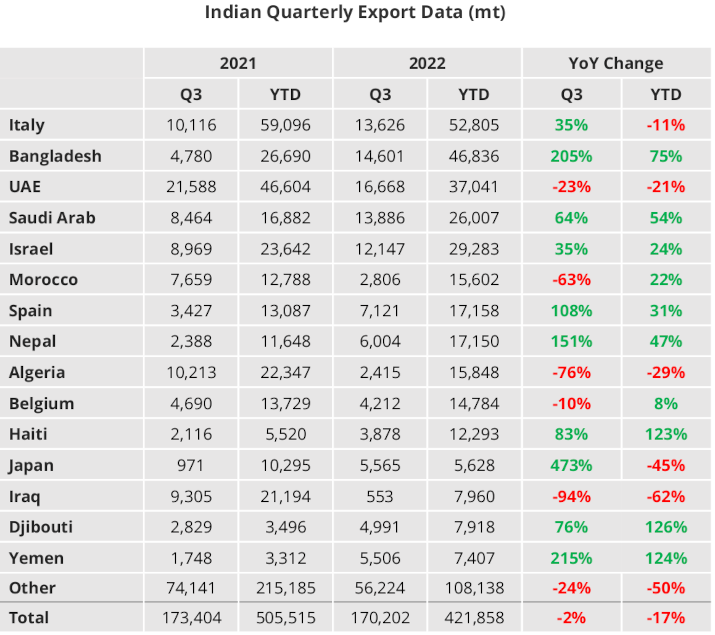
- Indian bottle-grade PET exports rose strongly to over 170k tonnes in Q3’22, up 35% on the previous quarter, yet still down 17% compared to the first three-quarters of 2021.
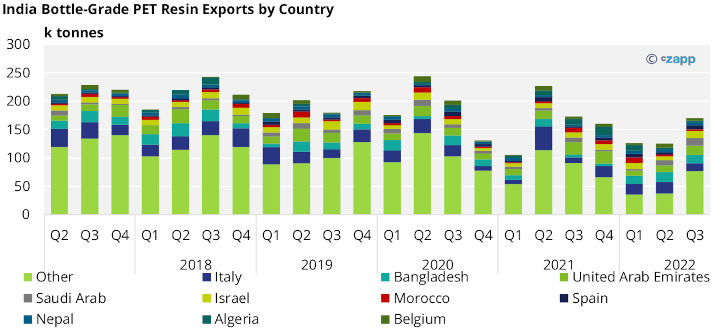
- UAE was again the largest destination with 16.7k tonnes in Q3 ’22, increasing 46% on the quarter, although year-to-date (YTD) exports to the UAE are still down 21%.
- The next largest export destinations were Bangladesh, Saudi Arabia, and Italy.
- Whilst volumes to Bangladesh have increased 75% YTD, Q3’22 experienced a quarterly decline of 20%. This drop may be related to the start-up of Meghna Group of Industries (MGI), Bangladesh’s own domestic production, earlier in 2022.
Quarterly Imports
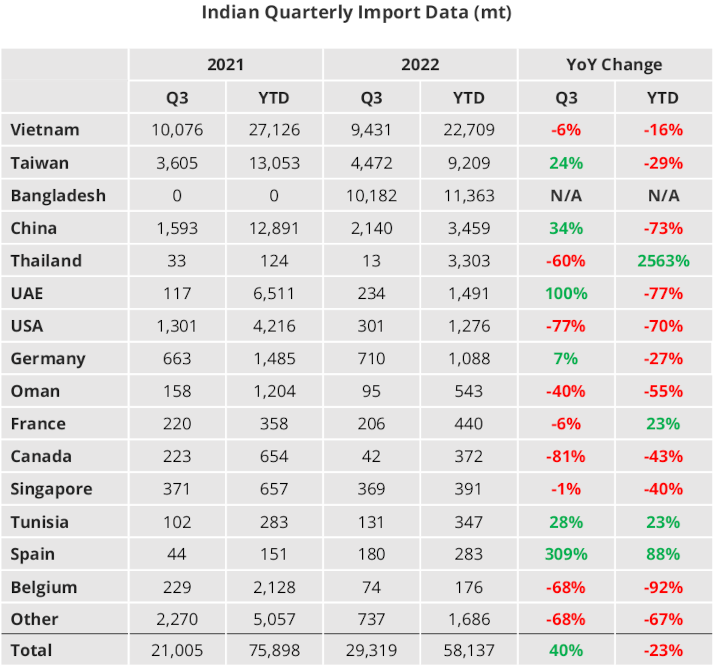
- Indian bottle-grade PET imports also rose in Q3’22, totalling 29.3k tonnes, nearly double the previous quarter, yet down 23% versus the previous year.
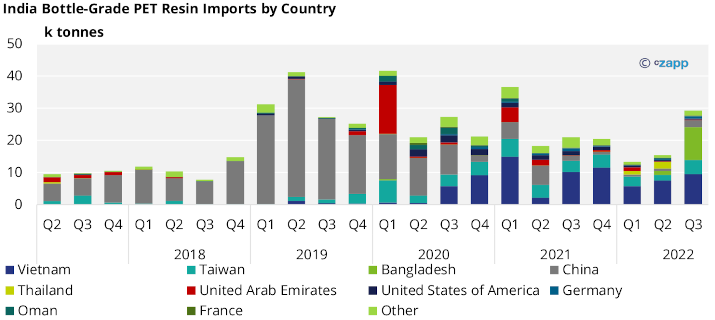
- Origins with the greatest volumes in Q3’22, included Bangladesh, Vietnam, and Taiwan.
- Bangladesh was responsible for the largest share volume of Indian PET resin imports, around 10.2k tonnes, as MGI volume begins to be exported.
- Vietnamese and Taiwanese resin represented 73% of the remaining total.
- Following the introduction of anti-dumping duties against Chinese PET resin into India in 2021, Vietnamese and Taiwanese resin has filled the import gap. Volume from Thailand has also entered the market in 2022.
Brazil’s Bottle-Grade PET Resin Market
Quarterly Imports
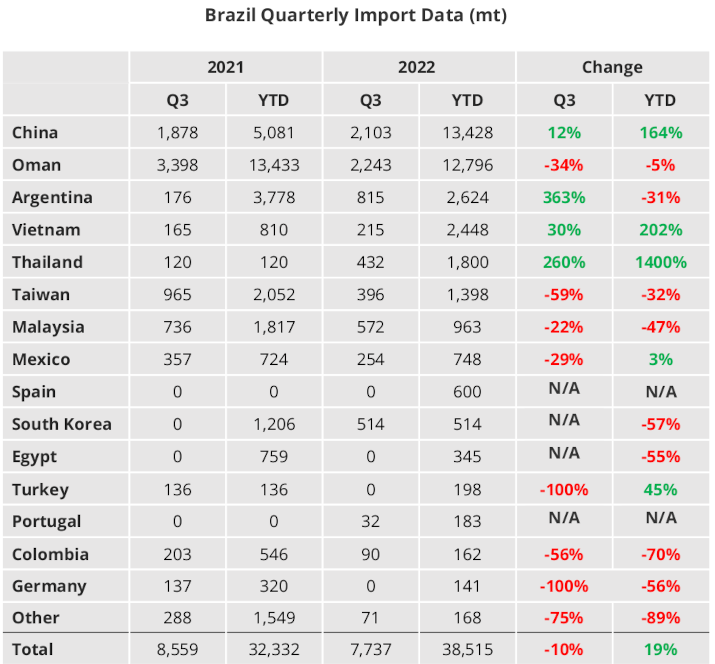
- Brazilian imports decreased once again to around 7.7k tonnes in Q3’22, a 46% decrease on the previous quarterly, YTD imports were still up 19%.
- Brazilian import volumes have moved back down towards historical pre-COVID levels, Chinese import levels have shrunk over the course of the year, falling over 51% in Q3’22 compared to the previous quarter.
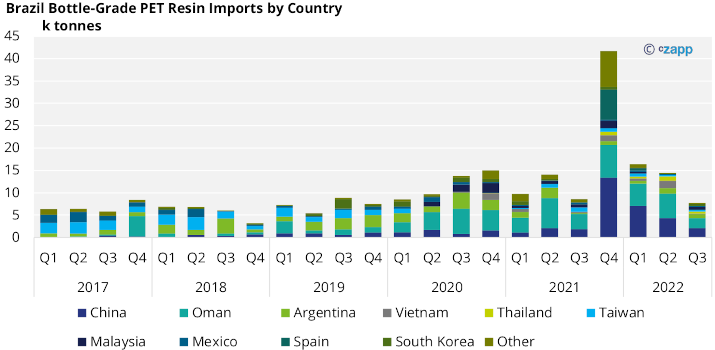
- Oman was once again the largest source of Brazilian PET resin imports, ahead of China in Q3’22. Around 29% of Brazilian imports were from Oman, whilst an additional 27% came from China.
Quarterly Exports
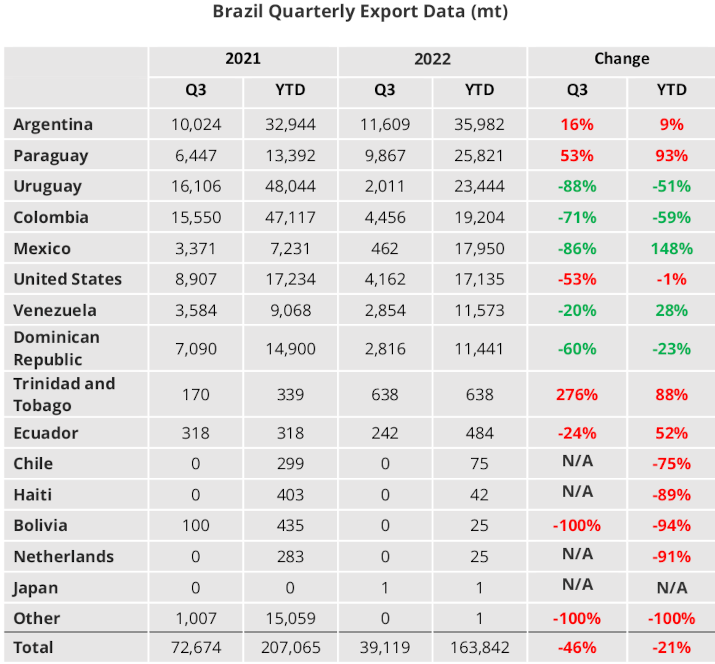
- Q3’22 exports slumped to around 39k tonnes, around half the previous month’s total, on par with pre-COVID levels.
- Largest Q3’22 destinations by volume included Argentina, Paraguay, Colombia, and the US.
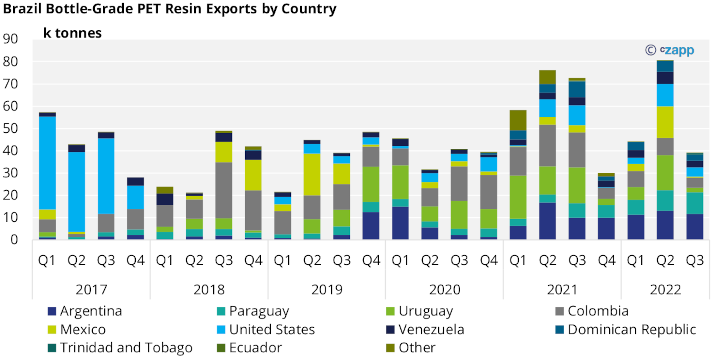
- Having surged in Q2’22, exports to Uruguay and Mexico saw the largest quarterly declines, falling 87%, and 97% respectively.
- Paraguay was one of the only major destinations where volumes experienced growth, up 5% on the previous quarter to around 9.9k tonnes in Q3’22. Total volumes to Paraguay have increased 93% YTD.
Data Appendix
If you have any questions, please get in touch with GLamb@czarnikow.com.
Other Insights That May Be of Interest…
European PET Market View: European PET Producers Facing Losses Contemplate Further Shutdowns
PET Resin Trade Flows: Korean PET Exporters Eye Greater European Share in 2023
Asia PET Market View: Will Plummeting Ocean Freight Boost Asian PET Export Demand?