Insight Focus
- Chinese PET export volumes continue to fall as foreign demand underperforms.
- Indian export dip, Chinese imports rebound due to tight Indian market in Q1’23.
- Brazilian PET resin exports drop to multi-year lows in first quarter.
China’s Bottle-Grade PET Resin Market
Monthly Exports
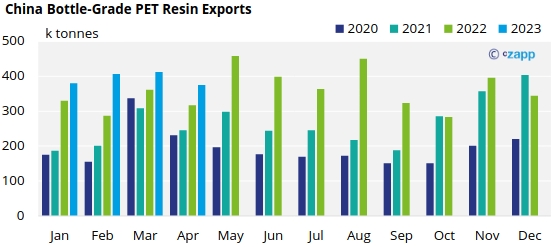
- Chinese bottle-grade PET exports (HS 39076110) totalled 375k tonnes in April, and whilst decreasing 9% on the previous quarter, monthly export levels were still 18.5% higher than the previous year.
- However, last year April 2022 levels were disrupted by severe lockdowns in Shanghai and other cities.
- Year-to-date Chinese PET resin exports have increased over 21% over the four-month period.
- That said, April export levels are reflective of weaker than anticipated export demand. Export order intake in April was estimated to be around 300k tonnes. As a result, further deterioration in export volume is expected in May.
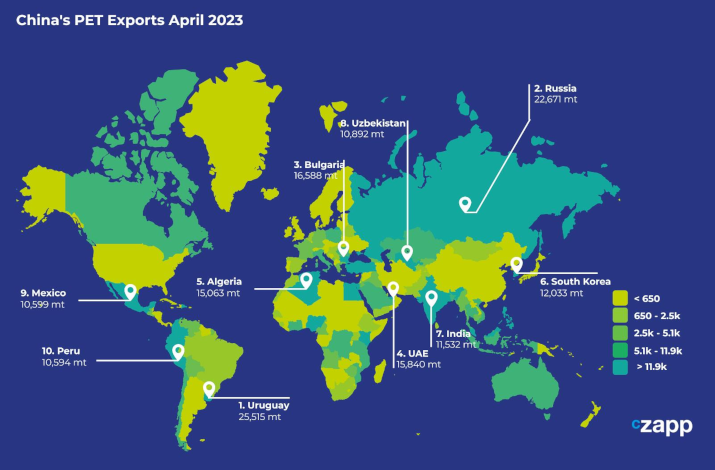
- Uruguay was the largest end market destination for Chinese PET resin exports in April with around 25.5k tonnes. Uruguay continues to see large monthly swinging in volumes due to continued breakbulk movements.
- Russia was the second largest destination with over 22.6k tonnes, down 7% from the previous month.
- Beyond the top two markets, which represent around 13% of the total monthly exports, other destinations over 15k tonnes in April included Bulgaria, the UAE, and Algeria.
- Bulgarian volumes vary considerably month-on-month; however, April’s levels were up 22% compared to the same month, the previous year.
- Uzbekistan also registered a 10% monthly increase, to 10.9k tonnes, whilst monthly volumes destined for the UAE and India fell by 8% and 63% respectively.
India Bottle-Grade PET Resin Market
Quarterly Exports
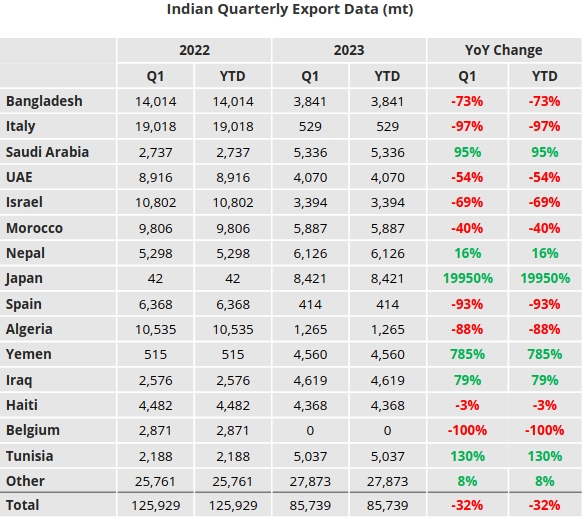
- Indian bottle-grade PET exports notched up a second consecutive quarter of steep declines, falling nearly 29% to less than 86k tonnes in Q1’23, up 35% on the previous quarter; down 32% compared to the first quarter of 2022.
- Even with most Indian PET resin producers running at close to full capacity, tighter domestic market conditions have led to a greater home focus over the last 6-months, as a result export availability has been greatly reduced.
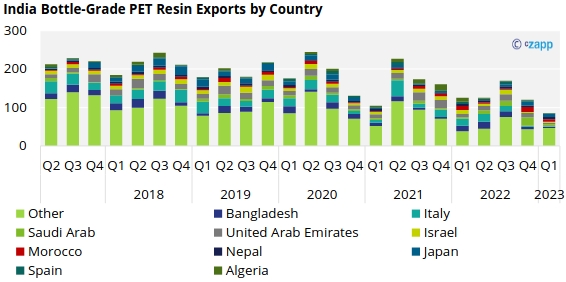
- Japan was the largest destination with 8.4k tonnes in Q1’23. Exports to Japan have rebounded sharply over the last 9-months, from almost nothing between Q3’21 and Q2’22. However, Q1 volumes are still up to 55% lower than pre-COVID levels.
- The next largest export destinations were Nepal, Morocco, Saudi Arabia, and Tunisia. Exports to Tunisia surged 184% quarter-on-quarter, to over 5k tonnes in Q1’23.
- Whilst volumes to the UAE and Bangladesh have slumped, experiencing quarterly declines of 64% and 44% respectively.
Quarterly Imports
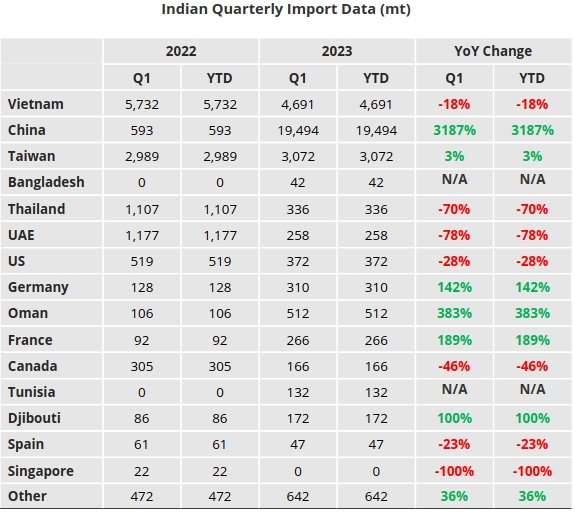
- Indian bottle-grade PET imports leapt 56% in Q1’23 versus the previous quarter, totalling 30.5k tonnes, more than double Q1’22.
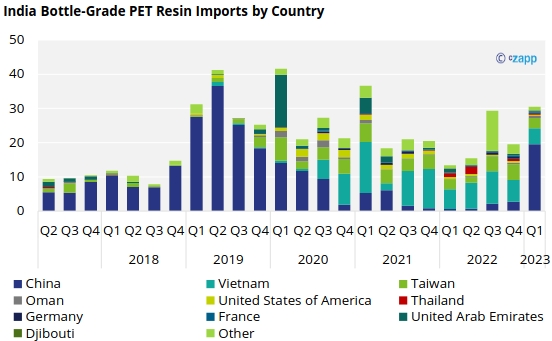
- China became the largest origin with around 14.5k tonnes in Q1’23, despite anti-dumping duties (ADD) on PET resin imports from China for five years from 27 March 2021.
- Following the introduction of anti-dumping duties against Chinese PET resin into India in 2021, Vietnamese and Taiwanese resin initially filled the import gap. Volume from Thailand has also entered the market in 2022.
- However, imports from these origins shrunk in Q1’23 by 25% and 34% versus Q4’22; Thai volumes were also down 48%.
- One Chinese producer in particular, with the lowest ADD of USD 15.54/tonne, was active in selling large volumes of PET resin in India during the Indian peak season in H1.
Brazil’s Bottle-Grade PET Resin Market
Quarterly Exports
- Brazilian PET resin exports fell to just 9.4k tonnes in Q1’23, down 76% on the previous quarter and 79% down on Q1’22.
- Only 5 destination countries were recorded, Paraguay, Argentina, Venezuela, Colombia, and Trinidad and Tobago.
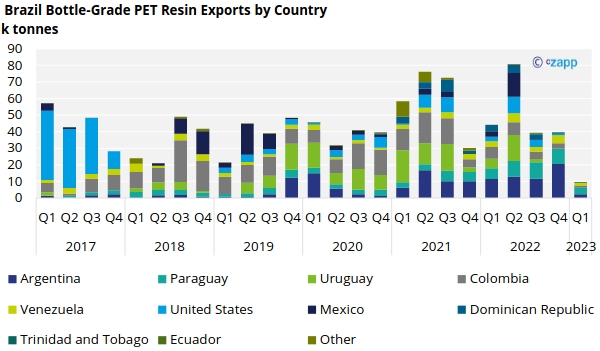
- Paraguay was the largest end market with 3.9k tonnes in the first quarter, representing 41% of total exports over that period. Volumes to the country were down 57% on the previous quarter, and 41% down on Q1’22.
- Argentina was the second largest destination with 2.3k tonnes in Q1’23, all others were less than 2k tonnes.
Quarterly Imports
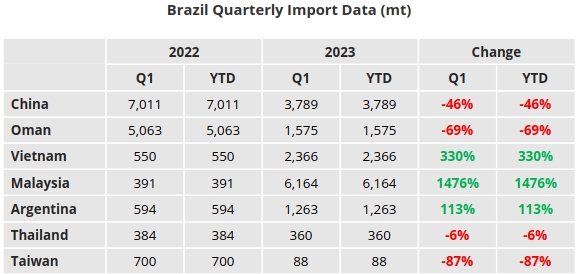
- Brazilian imports have continued to rebound since Q3’22, increasing a further 60% in Q1’23 to reach 17.6k tonnes, up 8% on Q1’22.
- Malaysia was the largest source of PET resin coming into the Brazilian market in Q1’23, followed by China, Vietnam, Oman, and Argentina.
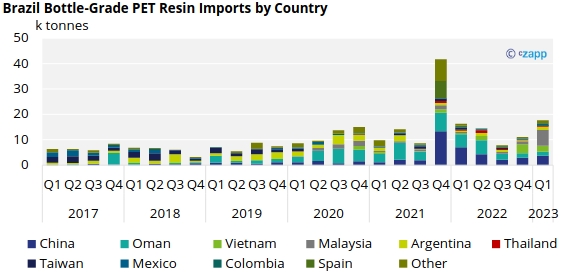
- Imports from Malaysia have steadily increased over the last 12-months, with 6.1k tonnes recorded in Q1’23, around 35% of total PET resin imports over that period.
- Whilst imports from Oman, once the largest source of Brazilian PET resin imports, have continued to shrink.
- Brazilian customs recorded just 1.6k tonnes of PET resin originating from Oman in the first quarter of 2023, down 11% on the previous quarter and 69% down on Q1’22.
- Omani imports are now at a 5-year low for the first quarter, down 53% on average Q1 levels since Q1’19.
Data Appendix

If you have any questions, please get in touch with GLamb@czarnikow.com.