
Every effort has been made to ensure accuracy but no guarantee is offered by Technical Commentary or Mike Ellis against errors or omissions and no liability will be accepted for any trading undertaken based on the analysis or suggestions provided herein. This information is intended solely for the personal and confidential use of the reader and may not be redistributed, retransmitted or disclosed, in whole or in part, or in any form or manner, without the written consent of Mike Ellis as principal of TechCom. Copyright © 2022 Technical Commentary.
Featuring 8 key futures markets that combined add up to more than 50% of the entire weighting of the Bloomberg Commodity Index (23 markets total) and augmented by analysis of the Bloomberg Index and the US Dollar Index, this report offers the preeminent heavyweight commodity sector portfolio.
For more information please contact Michael here.
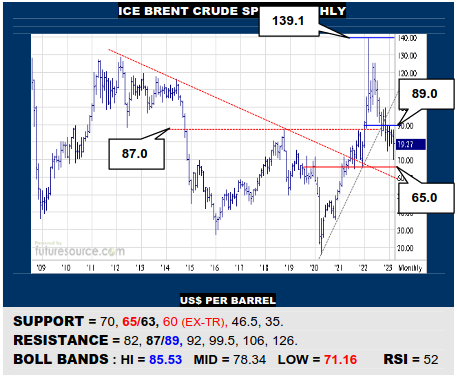
ICE BRENT CRUDE OIL SPOT MONTHLY
The satellite view highlights Brents’ major retrenchment from the early Ukraine war apex (139) but also suggests the 65 to 60 band is key support (63 a Fib retracement) over coming months. If buffered there, a subsequent rally across 87/89 could well light a new fire. Only chewing on through 60 would carve open even deeper depths to 46.
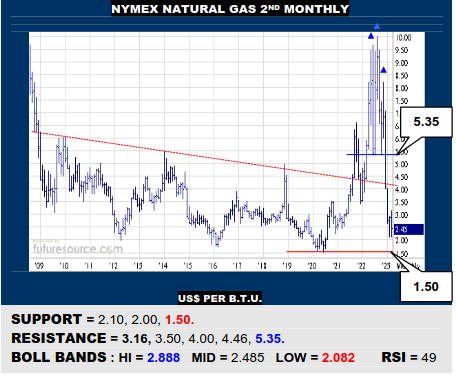
NYMEX NATURAL GAS 2ND MONTHLY
The dive from a very tall ’22 H&S has seen Nat Gas harass the 2.10 area in both Feb and Mch but this is still posting an outside month, hinting at a market bidding to reverse course. Looking for a clearer reaction over 3.16 in Q2 then to set up a corrective run towards 5.35. If not, a decisive break of 2.10 would pave the way on to 1.50.
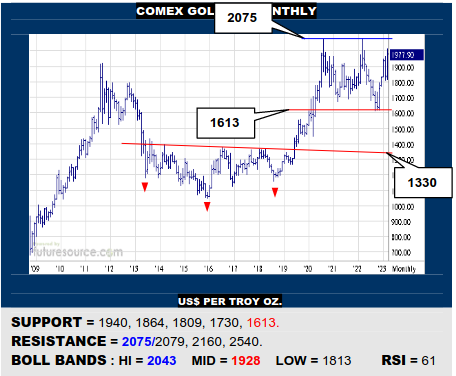
COMEX GOLD 2ND MONTHLY
A small new Q1 dual bottom has put Gold back on the scent of the long term highs at 2075/2079 but it was just a little edgy lately to post an inside week. This doesn’t merit panic but demands one eye on 1940 as a stumbling block back to the 1860’s. As long as 1940 held tight, an ultimate exit over the 2070’s could pave the way to 2540.
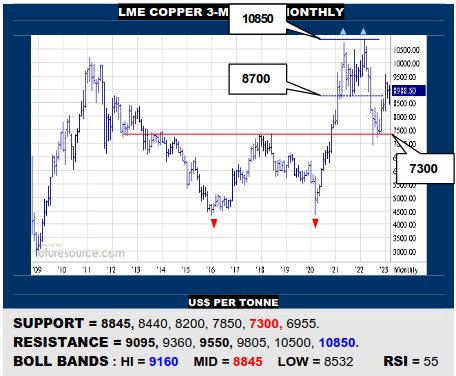
LME COPPER 3-MONTHS MONTHLY
The wide angle view highlights Coppers’ catch at the massive sub-7300 double bottom last year and it has punched back into the 8700+ dual top in Q1 this year. This action gives a bull flaggish vibe if 9095 were soon dislodged to light the way towards 10850 again. Do mind the mid band meantime though (8845) as its demise would dilute the flag hopes.
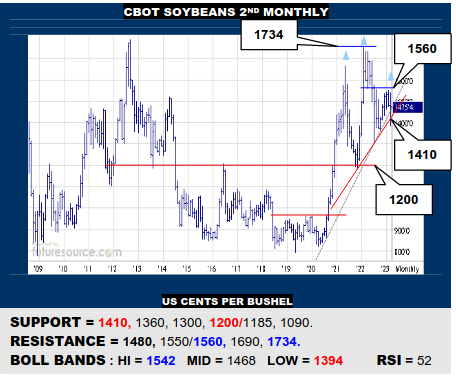
CBOT SOYBEANS 2ND MONTHLY
Rickety stuff in Mch but Beans have dodged a large monthly chart H&S by pivoting back up this week. Still needing to see a decisive resurfacing over 1480 to solidify this retrieval however, wherein previously elusive 1560 resistance could be back in play. If foiled in the 1480’s though, keep minding the 1410 neckline for fear of resolving that destructive top.
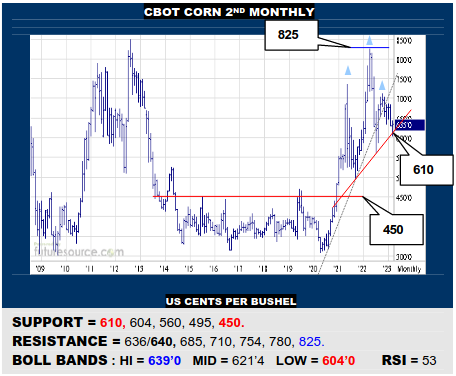
CBOT CORN 2ND MONTHLY
Similarly sidestepping a major new monthly H&S, Corn has rebounded to contest the 636/640 resistance instead. Clawing back above would steady the boat and bring the 685 resistance into sight once more. Alas, if blunted by the upper 630’s, keep watching 610 as the top neckline, a break threatening much more severe fallout towards 450.
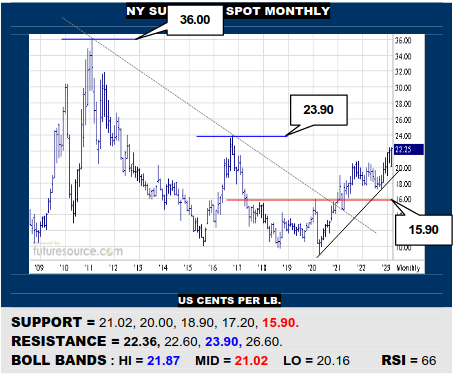
NY SUGAR #11 SPOT MONTHLY
Late in Q1 Sugar has finally shored up the passing of the torch from the Mch to May contract to attack the 22.36 continuation resistance again. This appears to move on from the prior year and a half of antsy ranging and the 10-year high at 23.90 looks increasingly attainable. Only further blunting at 22.36 and ousting from the 21’s would upend this advance.
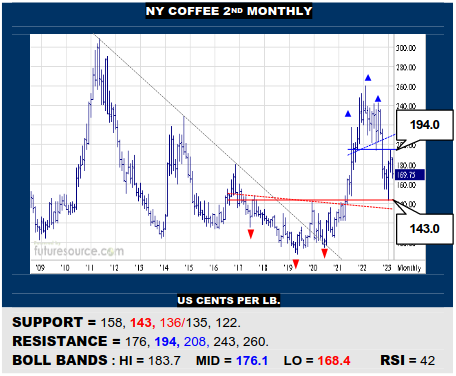
NY COFFEE 2ND MONTHLY
Coffee has pivoted accurately back and forth between the recent H&S above 194 and the former inverse H&S under 143 so for now it is in midrange terrain after the more recent top rebuke. This tilts the balance lower towards 143 currently while only a reflex back above the mid band (176) would prove greater resolve and turn sights higher once more.
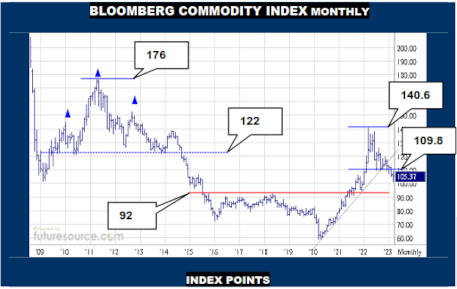
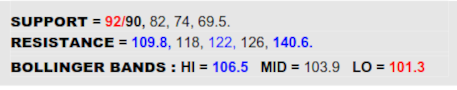
BLOOMBERG COMMODITY INDEX MONTHLY
The early stages of the Ukraine war saw the B-Berg intrude into a former large pre ’15 H&S over 122 but by mid ’22 it had been expelled again and that decay compounded in Q1 this year as the 109.8 level gave way, so pressing through a lesser 38.2% Fib retracement of the prior 59 to 140.6 upmove. Serious damage has been done to the commodity sector therefore and the current attempt to fight back would only yield truly hopeful results if the index resurfaced in the 110’s, then seeming to make more lasting repairs. Failure shy of 109.8 would otherwise leave a hefty ’22 top looming overhead with the lingering risk of a full 61.8% Fib retracement to 90.
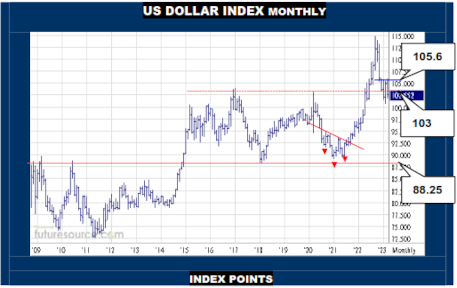
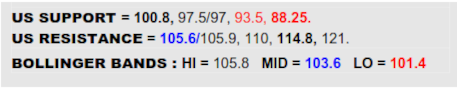
US DOLLAR INDEX MONTHLY
Fitting in with the daily scene where the chance for an inverse H&S has emerged during Q1, the monthly overview of the Dollar shows it wavering in and around what had become the 103 rim of a big ’17 to ’22 base. From the broad perspective, there duly remains that key question whether this large base is making a catch or not? If able to keep mopping up in triple digits and later rebound over 105.6, the argument would indeed be that ‘yes’ the base had prevailed and another leg towards 114.8 would look increasingly likely. On the other hand though, if swept out of triple digits, the base resurrection would fold and a bear flag could reveal a pretty big vacuum down to the 93’s.
Every effort has been made to ensure accuracy but no guarantee is offered by Technical Commentary or Mike Ellis against errors or omissions and no liability will be accepted for any trading undertaken based on the analysis or suggestions provided herein. This information is intended solely for the personal and confidential use of the reader and may not be redistributed, retransmitted or disclosed, in whole or in part, or in any form or manner, without the written consent of Mike Ellis as principal of TechCom. Copyright © 2022 Technical Commentary.