
Welcome to the third instalment of Czapp’s course on futures market spreads.
In previous explainers we looked at what a spread is, why they are relevant to market participants and analysts, and what the key drivers of futures market spreads are.
In this explainer we will cover the specific drivers of the No.11 raw sugar futures October-March spread.
In upcoming explainers we will look what factors drive the remaining No.11 raw sugar futures spreads.
No.11 Raw Sugar Futures Contract
There are four No.11 raw sugar futures contracts traded in a calendar year, the March, May, July, and October contracts. This means there are four spread pairs between neighbouring contracts, the October-March (V/H), March-May (H/K), May-July (K/N), and July-October (N/V). For more information on the No.11 raw sugar futures contract, please see our explainer.
October-March Spread Overview

Given the contract months involved, the October-March spread is relevant to supply and demand in the raw sugar market from the end of Q3 to the end Q1 the following year.
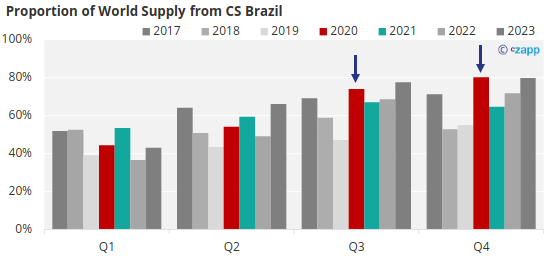
As such it is normally defined by the stock situation in Centre-South (CS) Brazil, the world’s largest producer and exporter of raw sugar. CS Brazil accounts for around 70-80% of world raw sugar supply, and has large sway over world prices.
By October the CS Brazil harvest will have been running since around April and cane crushing will have peaked. Logistics limitations also mean that the mills will have been producing sugar at around twice the rate that it can be exported.
This means that stocks and sugar availability by October are generally at their peak, or close to it.

The CS Brazil season then comes to an end shortly after October, entering the off crop where mills undertake annual maintenance.
As a result, by March stocks (and supply) in the country are at their lowest, making finding sugar on the world market harder, pushing up the price of the March contract.
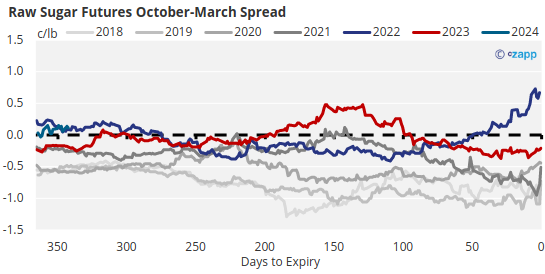
This supply differential means that the October-March spread under normal circumstances tends to trade at a discount, though there are exceptions to this when the market is stressed.
Who has Sugar to be Delivered into the Expiry?
Sugar priced against the October raw futures contract is generally shipped in late Q3-Q4. For sugar specifically delivered through the exchange the delivery window is 75 days long, from the 1st of October to the 15th of December. To understand the distinction here is an explainer on what futures markets are used for.
By Q4 the major northern hemisphere cane crop producers will have long finished their seasons, and their new seasons won’t have fully picked up yet.
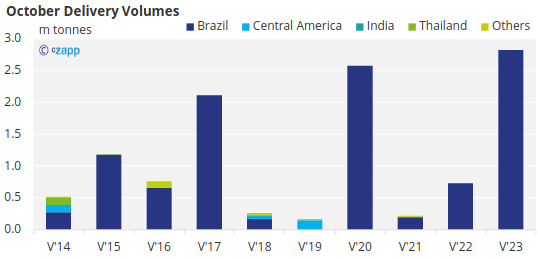
This means that normally CS Brazil will account for the vast majority of sugar supplied to the world market around this time.

Though Australia, another southern hemisphere exporter will also be involved.
This also makes the October contract a fairly ‘clean’ expiry for those buying through the exchange since the buyer will usually have confidence that they’ll receive sugar from a single origin, Brazil.
The 2023 October contract expired with a record volume of sugar to be delivered through the exchange, almost 3m tonnes.
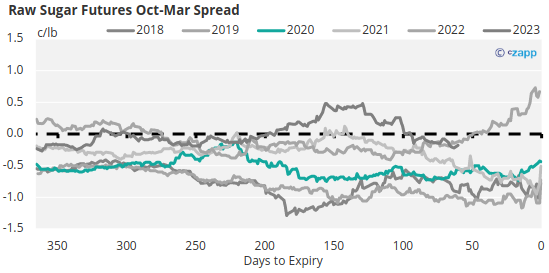
The 2023 October-March spread shifted significantly over its last four months of trading, moving from a 40-point (0.4c/lb) premium, to almost a 40-point discount once it became clearer that there would be greater than normal supply from CS Brazil.

What Should be Paid Attention to?
Since the October-March spread is generally defined by sugar available from CS Brazil, this means understanding:
- How the sugar cane is expected to develop during the CS Brazil off crop.
- How stock levels are looking in CS Brazil.
- Whether sugar or ethanol pays better for CS Brazilian mills.
- Whether CS Brazil exports are timely or bottlenecked earlier in the season.
- Whether there is an unusual volume of sugar from other origins, and what the quality of that sugar is.
Beside this it also valuable to pay attention to the cost of carry in delivering that sugar against the March contract instead of the October, as this can inform at what level of discount the spread needs to trade at.
Aside from seasonal differences, the other key driver of CS Brazil sugar export availability is the difference between domestic ethanol prices and world market sugar prices, since mills in the centre-south are able to produce both.

Some seasons, like 2020/21, 2021/22 and 2023/24, sugar paid much better for mills and sugar production was maximised at the expense of ethanol. Other seasons like 2018/19 and 2019/20 ethanol returns were stronger and so ethanol production was prioritised.
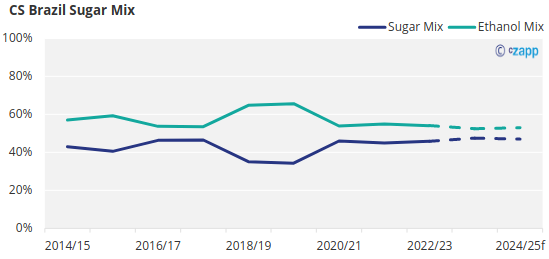
Let’s look at 2020/21, a good example of Oct-March spread behaviour, a maximum sugar mix season for CS Brazil, combined with a strong sugar cane crop in CS Brazil.
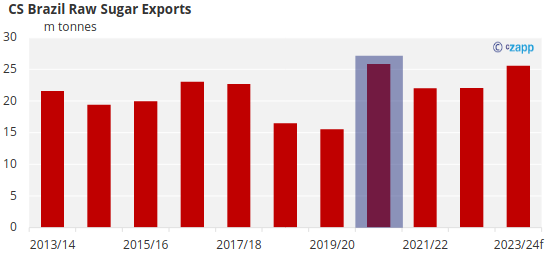
Due to the logistical constraints exporting sugar from the ports early in the season, the difference between a small and a large Brazil crop is usually felt more toward the end of the year, Q3 and Q4.
As such, in 2020, CS Brazil accounted for a particularly large proportion of world raw sugar supply in the second half of that year.
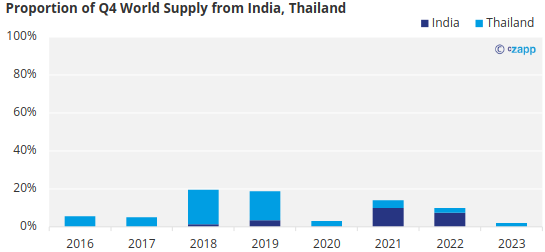
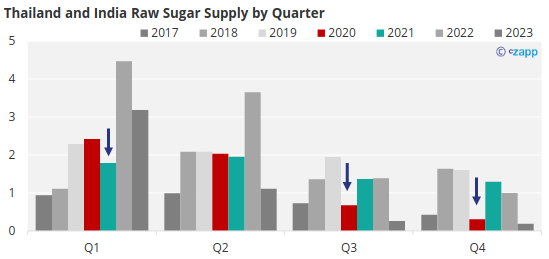
This came at a time when India and Thailand, other major raw sugar exporters were not able to supply the market in the second half of the year. 2020 was one of the worst years for Thai and Indian supply in Q3 and Q4 for a decade. Whilst Q1 of 2021 was weak too.
Good availability from CS Brazil in Q3 and Q4, and the expectation of weak availability from alternatives in Q1 the following year meant the Oct-Mar spread needed to trade at a discount to encourage supply to be deferred to where it was more needed, toward Q1.
As such the 2020 October-March spread traded at over a 50 point discount for around 6 months before it expired. This was a level sufficient for mills to cover their warehousing, and insurance costs per month between October and March, the cost of carry.
Looking at another example, mills in CS Brazil during the two seasons before this prioritised ethanol production, meaning sugar exports from CS Brazil were unusually weak.

Yet in the corresponding years, 2018 and 2019, the October-March spread traded at an even larger discount, closer to 100 points, why?
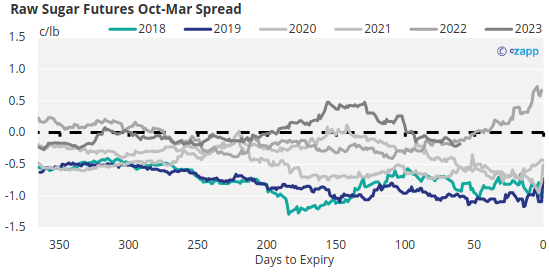
On the surface this doesn’t look like it fits the rules of the above example, though it does. Worse supply from Brazil was somewhat offset by increased availability of Thai sugar during these seasons.
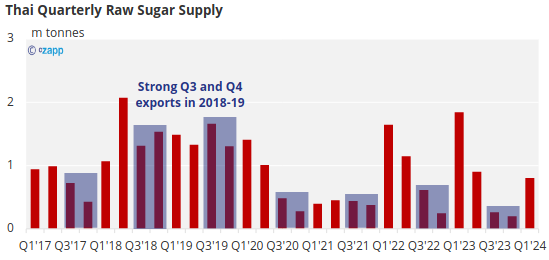
In this case the October contract needed to weaken to allow old Thai sugar from earlier in the year to be sold.
Therefore, in both 2018 and 2019, whilst there was less sugar available from Brazil around October, Thailand was able to make up for some of this shortfall, this meant there was still a relative abundance of supply compared to the March contract.
However, since the quality of Thai raw sugar by that point in the year was lower than Brazil’s sugar, the October contract had to weaken even further to encourage it to be sold.
Exceptions to the Rule
This leads nicely on to a recent exception to this rule, the October-March spread expired at a premium in 2022, the first time in a decade.
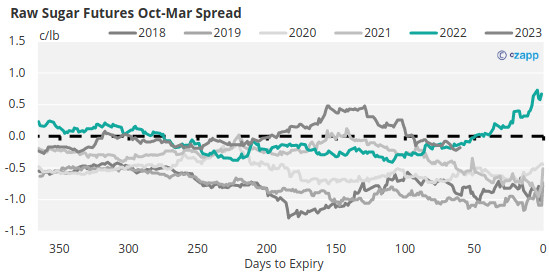
Checking against our list of factors to look out for, it is clear why.
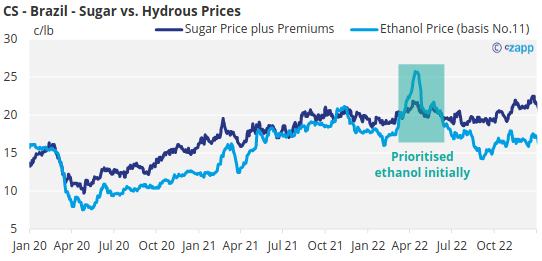
Stocks in CS Brazil were lower than normal during the 2022/23 season, particularly during the peak months of October and November.
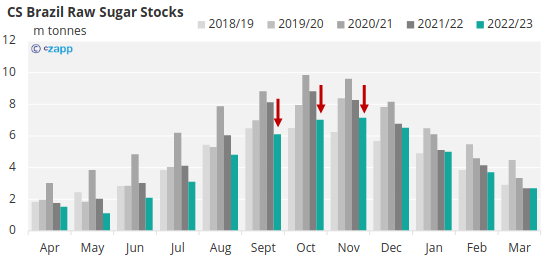
This was due to a slow start to crushing, and an initial focus on ethanol production early in the season.
This was worsened by bottlenecks at the port of Santos, limiting the timely flow of exports throughout the earlier part of the season.

This was in part due to strong demand, particularly in Q3, which also helped support the October contract price.
Lastly supply from alternate origins was limited, the cane harvest in Australia was behind schedule due to heavy rains, whilst exports from India had been banned until the new season started in November.
As such, with many of the factors to look out for all present here, it is now not surprising that the V/H spread in 2022 was squeezed into trading at a premium.