| Settlement (cUS$/lb) | Open | High | Low | Last | Volume | O/I | Life High | Life Low | |||
|---|---|---|---|---|---|---|---|---|---|---|---|
| Date | Spread | Date | Spread |
|---|---|---|---|
| Mar27 / May27 | 0.55 | Oct27 / Mar28 | -0.42 |
| Mar27 / Jul27 | 0.89 | Oct27 / May28 | 0.52 |
| Mar27 / Oct27 | 0.88 | Mar28 / May28 | 0.94 |
| Mar27 / Mar28 | 0.46 | Mar28 / Jul28 | 1.38 |
| May27 / Jul27 | 0.34 | May28 / Jul28 | 0.44 |
| May27 / Oct27 | 0.33 | May28 / Oct28 | 0.43 |
| Jul27 / Oct27 | -0.01 | Jul28 / Oct28 | -0.01 |
| Jul27 / Mar28 | -0.43 | Jul28 / Mar29 | -0.49 |
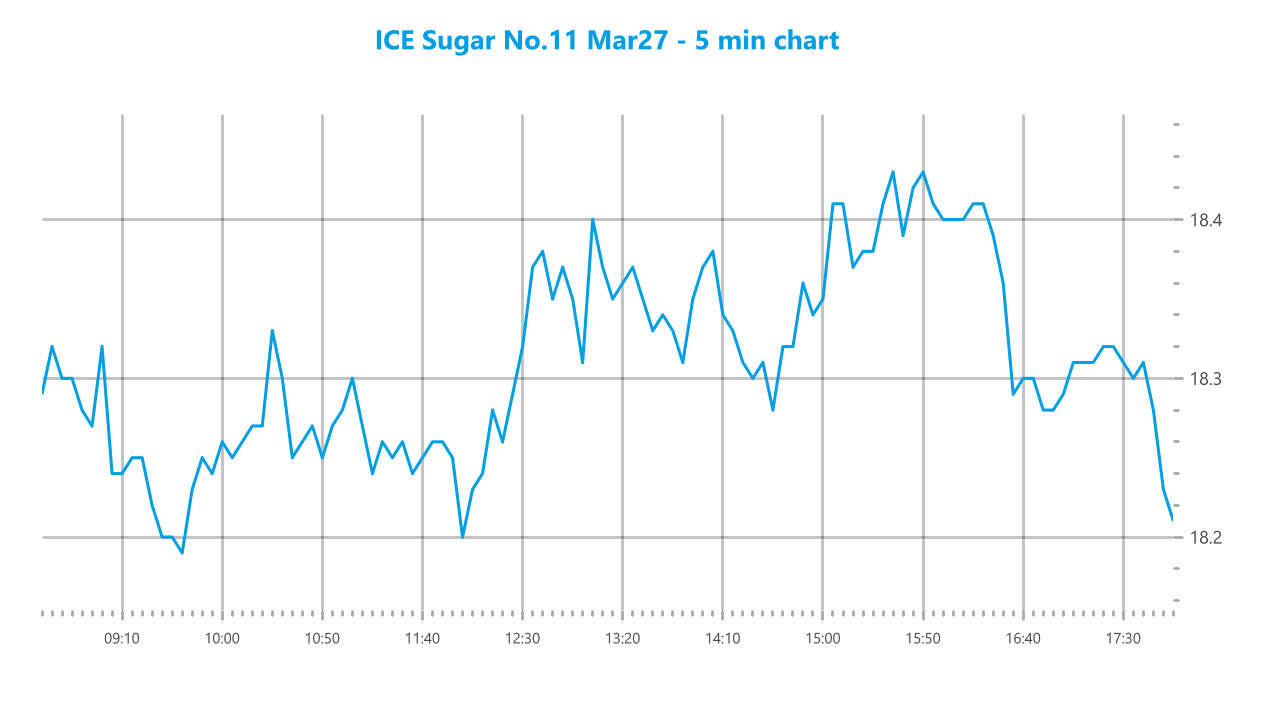
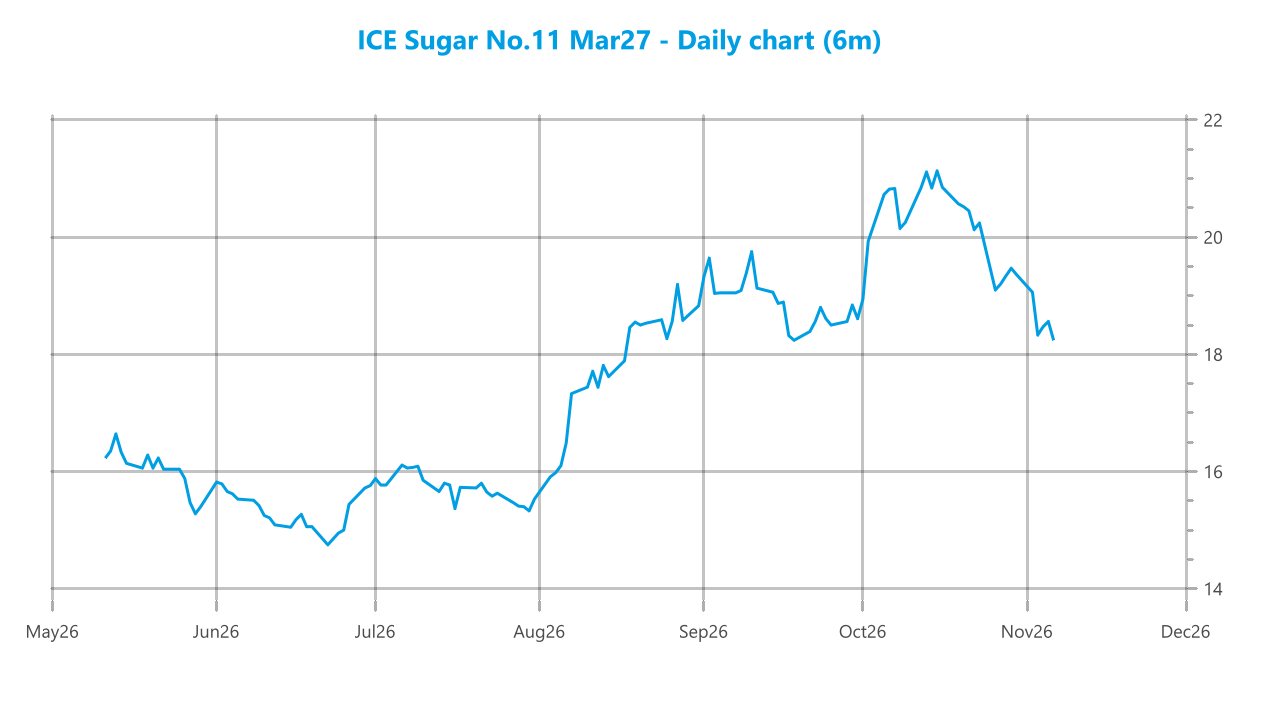
The new week arrived, but very little had changed as trading good off to a slow start. March’27 maintained a narrow band between 18.18 and 18.33 across a tedious morning period in which the only apparent interest came from smaller traders alongside underlying consumer scale buying. Fridays COT report had shown another reduction in the spec/fund holding to +146,031 lots, primarily due to position reduction on the long side, though a smaller number of new shorts were also added, however there was no sign of that changing in any meaningful way today as smaller traders continued to dominate interest into the afternoon. Their efforts helped March’27 up into the 18.40’s but progress stalled when their buying did the same and trading simply developed into a new, slightly higher, band. Highs were recorded at 18.44 prior to small traders closing back out some exposure, leaving the market top sit around 18.30 as it headed quietly towards the close holding on to minor gains. One final round of position liquidation then followed as we headed into the call, and this one sent the price back towards the bottom of the range leading to a slightly lower closing price at 18.21 that leaves parameters unmoved.
| Settlement (US$/mt) | Open | High | Low | Last | Volume | O/I | Life High | Life Low | |||
|---|---|---|---|---|---|---|---|---|---|---|---|
| Date | Spread | Date | Spread |
|---|---|---|---|
| Dec26 / Mar27 | -7.70 | Mar27 / May27 | -1.00 |
| Dec26 / May27 | -8.70 | May27 / Aug27 | 5.90 |
| Dec26 / Aug27 | -2.80 | Aug27 / Oct27 | 5.70 |
| Dec26 / Oct27 | 2.90 | Oct27 / Dec27 | 3.30 |
| Date | Premium | Date | Premium |
|---|---|---|---|
| Mar27 / Mar27 | 115.84 | Jul28 / Aug28 | 125.90 |
| May27 / May27 | 128.96 | Oct28 / Oct28 | 118.48 |
| Jul27 / Aug27 | 130.56 | Mar29 / Mar29 | 108.90 |
| Oct27 / Oct27 | 124.64 | May29 / May29 | 113.72 |
| Mar28 / Mar28 | 110.38 | Jul29 / Aug29 | 114.91 |
| May28 / May28 | 124.50 |
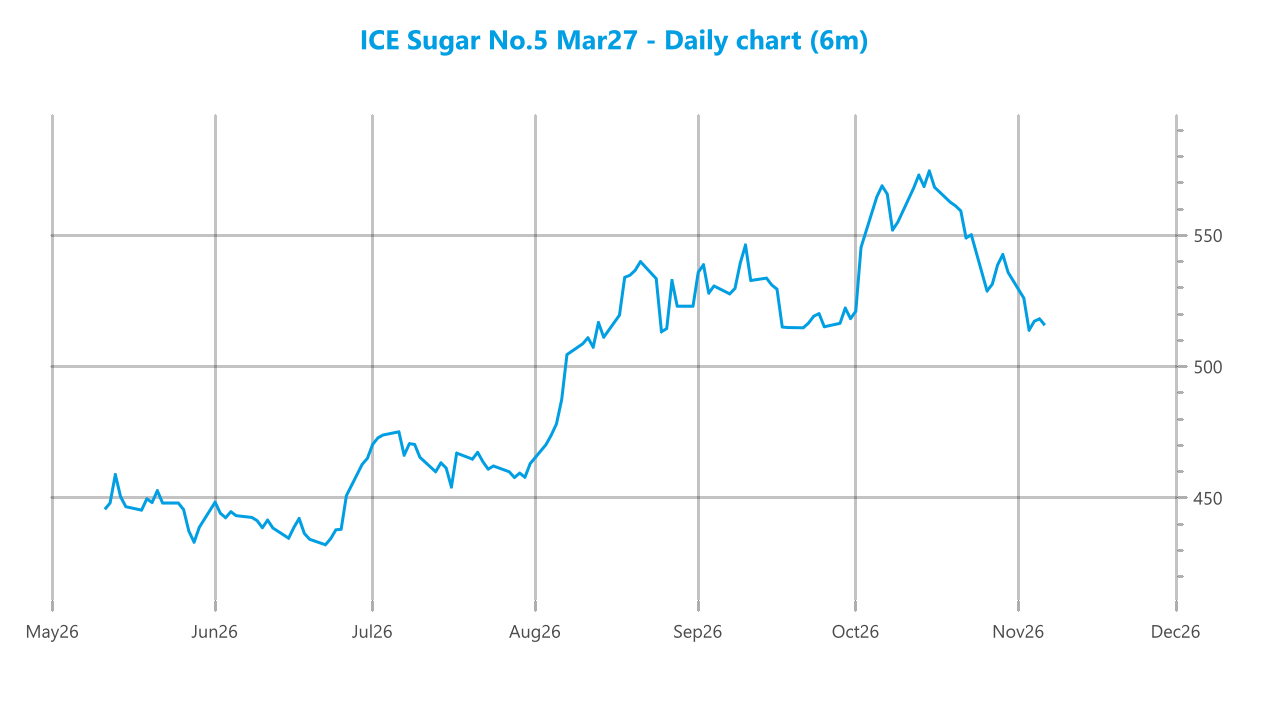
It was an inauspicious start to the week with March’27 trading either side of unchanged across the first hour, giving no indication as to a preferred direction of travel. This pattern maintained throughout a very quiet morning where the only movement of interest was being seen by the spot, where Dec’26 found a surge of buying which brought the Dec’26/March’27 spread to -$9.00 just after noon, its highest level in four weeks. Whether related to order flow or the start of a final week squeeze, the movement was certainly striking, and it continued through early afternoon with March’27 following some of the gains and pulling up into the low $520’s. This mirrored what was being seen for the No.11, but while values were holding positively any continuation was proving tricky as buyers largely held to the lower levels and failed to chase upwards. As such the afternoon saw a band held either side of $520.00, with most interest continuing to be seen through the spreads. The “pull” factor of Dec’26 was also aiding the white premium values, and during the afternoon March/March’27 worked its was towards $116.00 rep[resenting its highest value since mid-September. Dec’26/March’27 saw highs at -$4.70 before slipping back to end the day at -$7.70, still a constructive showing for the spread which will be keenly watched to see whether the receiver looks to bring it back to a premium. MOC selling knocked March’27 back to close at $517.30, a net gain though not of any significance to alter the chart picture.