Insight Focus
Global container freight markets diverged in August. Transpacific and South American rates strengthened as blank sailings, canal restrictions and weather-related congestion constrained effective capacity. Meanwhile weaker demand and excess vessel supply pushed Asia–Europe prices lower. Carriers sustained pricing on stronger lanes by selectively withdrawing capacity and prioritising higher-yield cargo.
Rates Split by Route
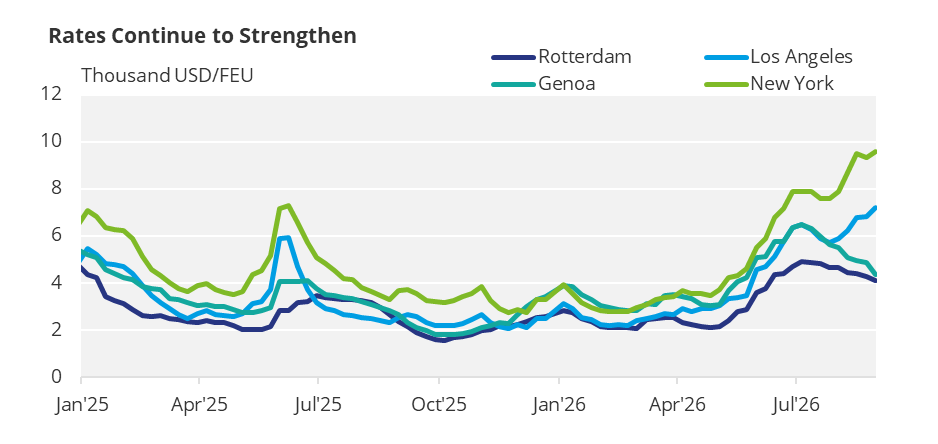
Global container pricing became increasingly fragmented during August and early September. On 3 September, Drewry’s World Container Index stood at USD 4,465/FEU, unchanged overall but 112% above the previous year.
Beneath the headline, Transpacific and Transatlantic rates rose by 4% and 1%, respectively, while Asia–North Europe and Mediterranean rates declined by 7%. The Freightos Baltic Index subsequently fell 2% to USD 3,520, while Chinese indices moved differently: the SCFI rose 2.3%, the CCFI added 0.2% and the NCFI declined 0.6%. The conflicting benchmarks reflect sharp route-level differences rather than a clear global direction.
Asia–US pricing strengthened after softening at the beginning of August. By early September, Shanghai–Los Angeles had reached USD 7,185/FEU, up 5% week on week, while Shanghai–New York rose 3% to USD 9,587/FEU.
Source: Drewry
This followed respective increases of 9% and 3% in the Freightos West and East Coast indices during the week of 18 August. Carriers supported pricing through capacity management: 14 Transpacific blank sailings were scheduled between August 24 and September 13, with eight concentrated in the week beginning August 31. Higher retail replenishment, weather disruption and General Rate Increases also contributed to the firmer market.
Europe Moves Lower, South America Overperforms
Asia–Europe followed the opposite trajectory. Between 3 August and 1 September, Shanghai–Rotterdam declined 7.5% to USD 4,452/FEU, while Shanghai–Genoa fell 13% to USD 4,910/FEU. By early September, reported levels had fallen further to USD 4,092/FEU for Rotterdam and USD 4,368/FEU for Genoa, representing weekly declines of 5% and 10%.
The correction reflected weaker demand, improving space availability and excess capacity, including newly deployed large vessels. Congestion prevented a more orderly fall, but did not reverse the underlying downward pressure.
The sharpest increase was recorded on Asia–South America routes. From August 3 to September 1, Shanghai–Santos prices rose 52.5%, from USD 6,025/FEU to USD 9,188/FEU, while West Coast South America increased 53.7%, from USD 5,121/FEU to USD 7,870/FEU.
Early-September China-origin quotations placed Mexico and West Coast South America at approximately USD 7,000–8,100/FEU, and East Coast South America at USD 8,700–9,700/FEU. Capacity rationing and the prioritisation of higher-yield services helped produce a considerably tighter market than on Asia–Europe.
East–West Differentials Widen
The main geographic differential was therefore between expensive Americas-bound cargo and cheaper Europe-bound cargo. In early September, Shanghai–New York was about USD 5,495/FEUFEU higher than Shanghai–Rotterdam, while Shanghai–Los Angeles carried a premium of roughly USD 3,093/FEU.
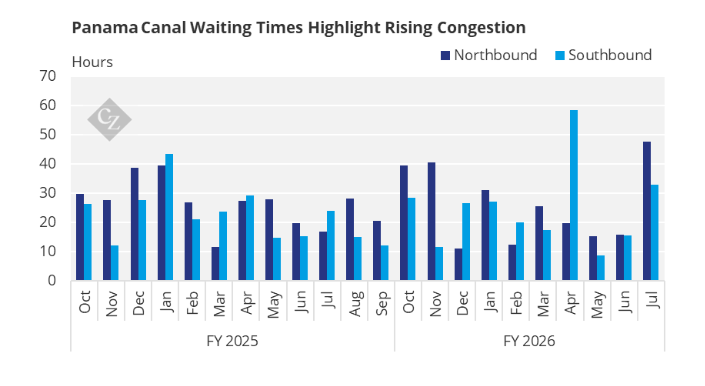
Within the US market, New York stood around USD2,402/FEU above Los Angeles, reflecting tighter East Coast capacity and Panama Canal constraints. Published assessments noted that East Coast and Gulf Coast space remained tighter than West Coast availability throughout August.
Source: Panama Canal
Europe-bound shippers had more room to compare carriers, delay non-urgent bookings and benefit from softer spot rates. Routing via the US West Coast offered a lower headline rate than East Coast services, though inland transport and overall transit costs still had to be factored in.
For time-sensitive Americas cargo, booking earlier and securing allocations helped reduce exposure to further rate increases, rollovers or blank sailings. The data points to scope for adjusting timing, carrier or gateway, but not to a universal reduction in total landed cost.
Congestion Removes Capacity
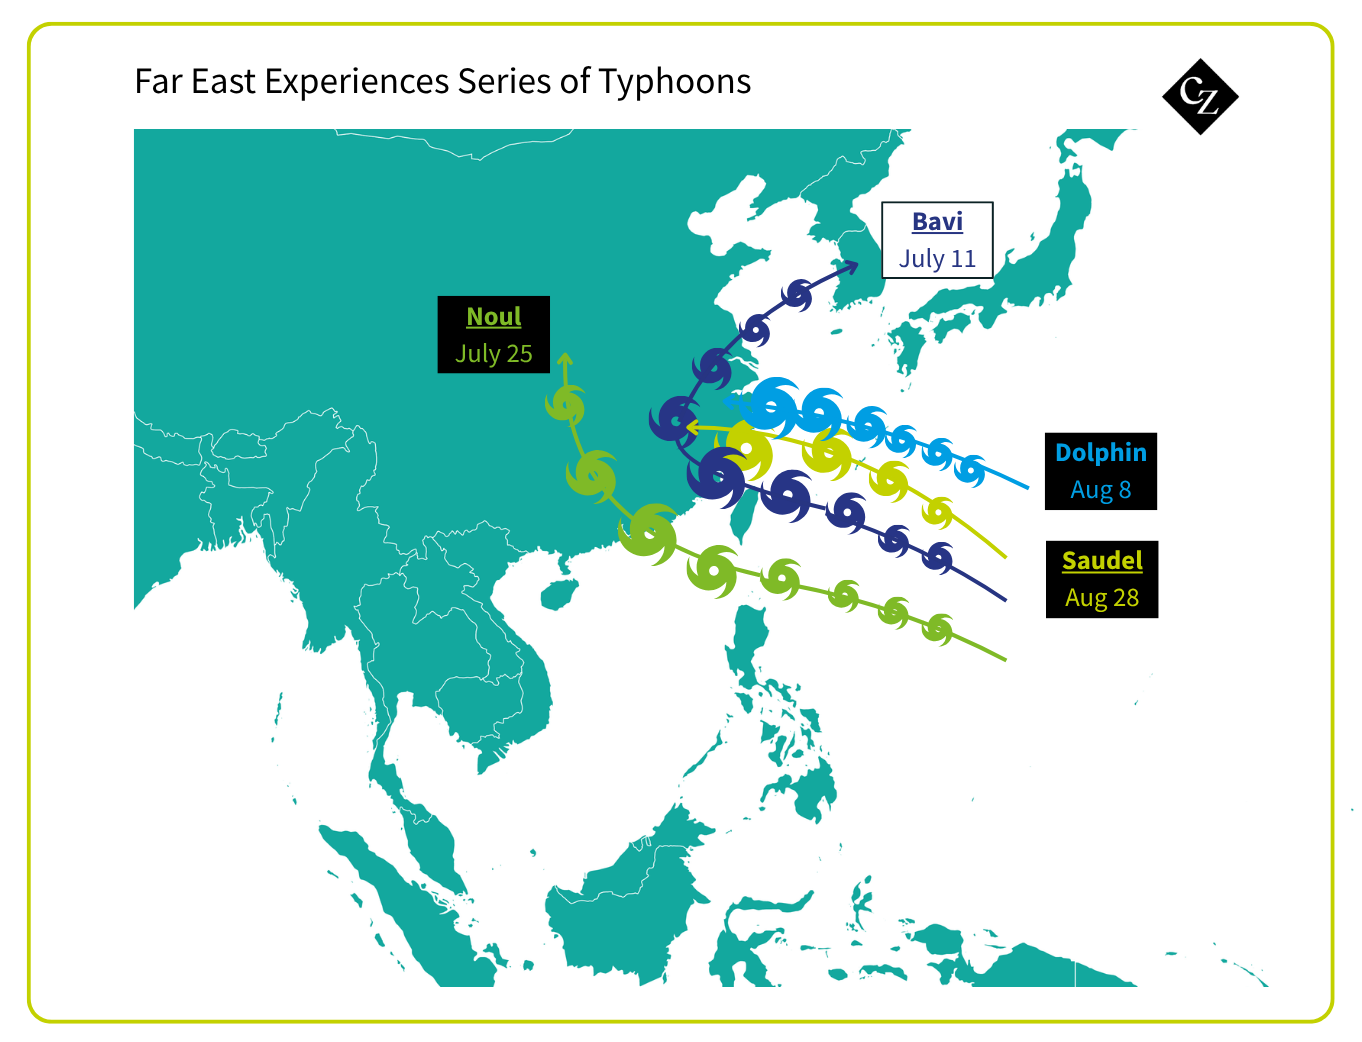
Typhoons materially reduced effective vessel supply. Shanghai congestion reached 201 vessels waiting in mid-August, with delays of up to 12 days; the queue had fallen to 139 vessels by 19 August. Shanghai and Ningbo subsequently experienced delays of up to ten days, while congestion immobilised an estimated 3.92 million TEU of capacity. Weather disruption caused port closures, vessel bunching, omitted calls and equipment imbalances across East Asia.
The underlying market remained structurally well supplied, with an estimated 3.6% increase in fleet capacity during 2026 and subdued Western demand. However, carriers prevented that surplus from translating evenly into lower spot prices by cancelling sailings and shifting capacity towards higher-yield routes.
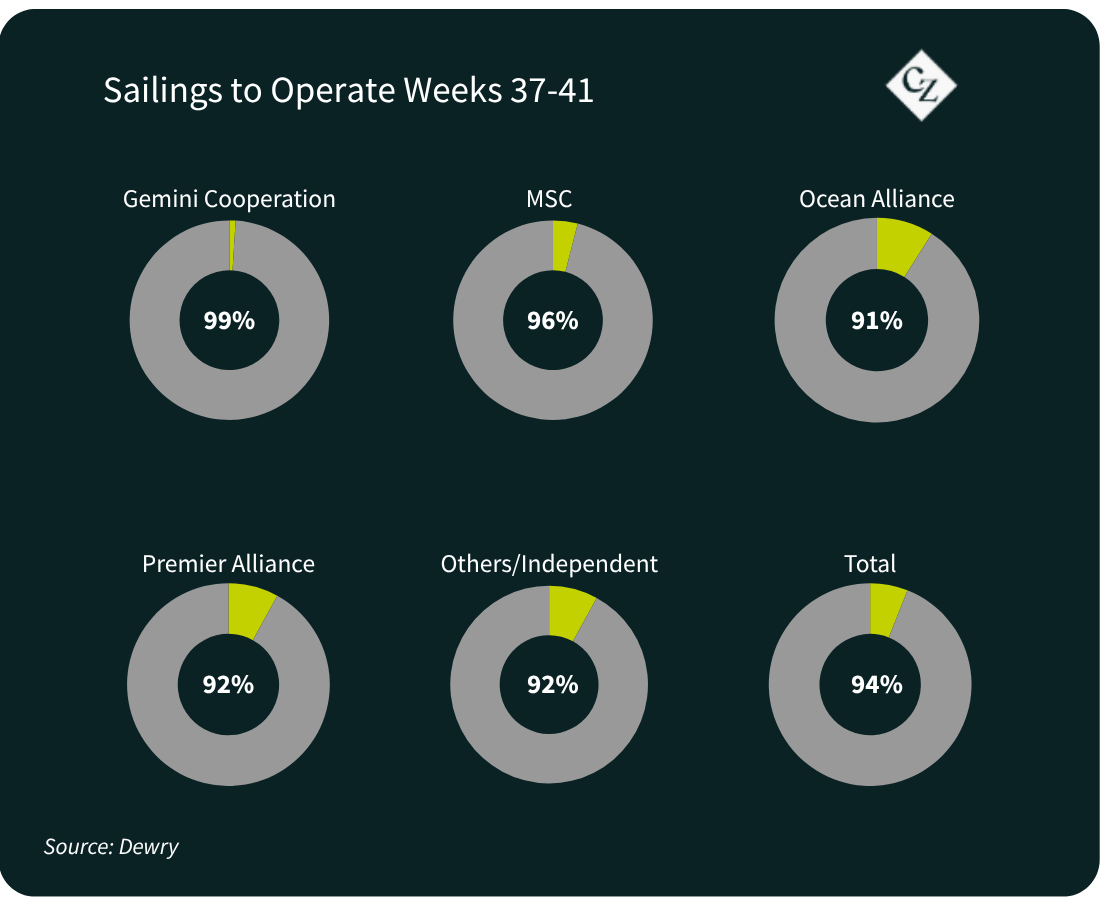
Drewry expected 47 cancellations from September 7 to October 11, equal to 6% of 729 scheduled East–West sailings. About 68% of the cancellations were on the eastbound Transpacific. The result was managed scarcity in the Americas alongside visible overcapacity and falling prices on Asia–Europe.