| Settlement (cUS$/lb) | Open | High | Low | Last | Volume | O/I | Life High | Life Low | |||
|---|---|---|---|---|---|---|---|---|---|---|---|
| Date | Spread | Date | Spread |
|---|---|---|---|
| Oct26 / Mar27 | -0.91 | Jul27 / Oct27 | -0.32 |
| Oct26 / May27 | -0.71 | Jul27 / Mar28 | -1.01 |
| Oct26 / Jul27 | -0.72 | Oct27 / Mar28 | -0.69 |
| Oct26 / Oct27 | -1.04 | Oct27 / May28 | -0.41 |
| Mar27 / May27 | 0.20 | Mar28 / May28 | 0.28 |
| Mar27 / Jul27 | 0.19 | Mar28 / Jul28 | 0.36 |
| May27 / Jul27 | -0.01 | May28 / Jul28 | 0.08 |
| May27 / Oct27 | -0.33 | May28 / Oct28 | -0.12 |
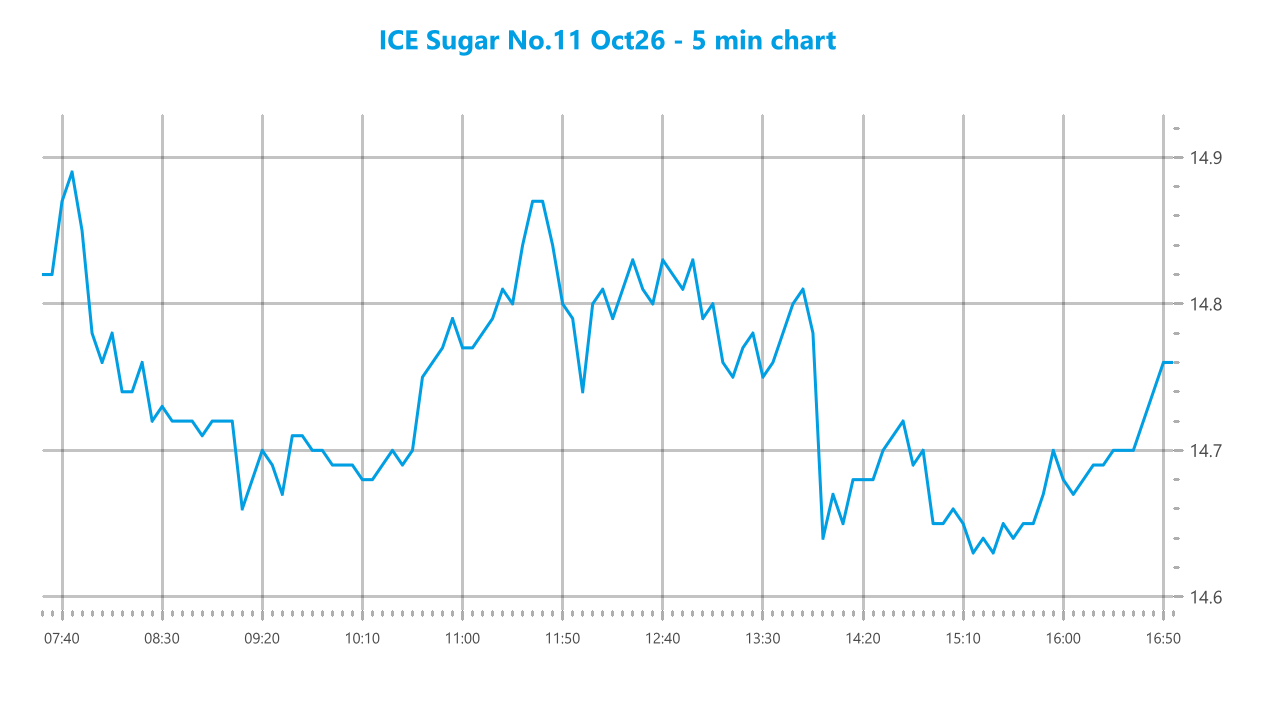
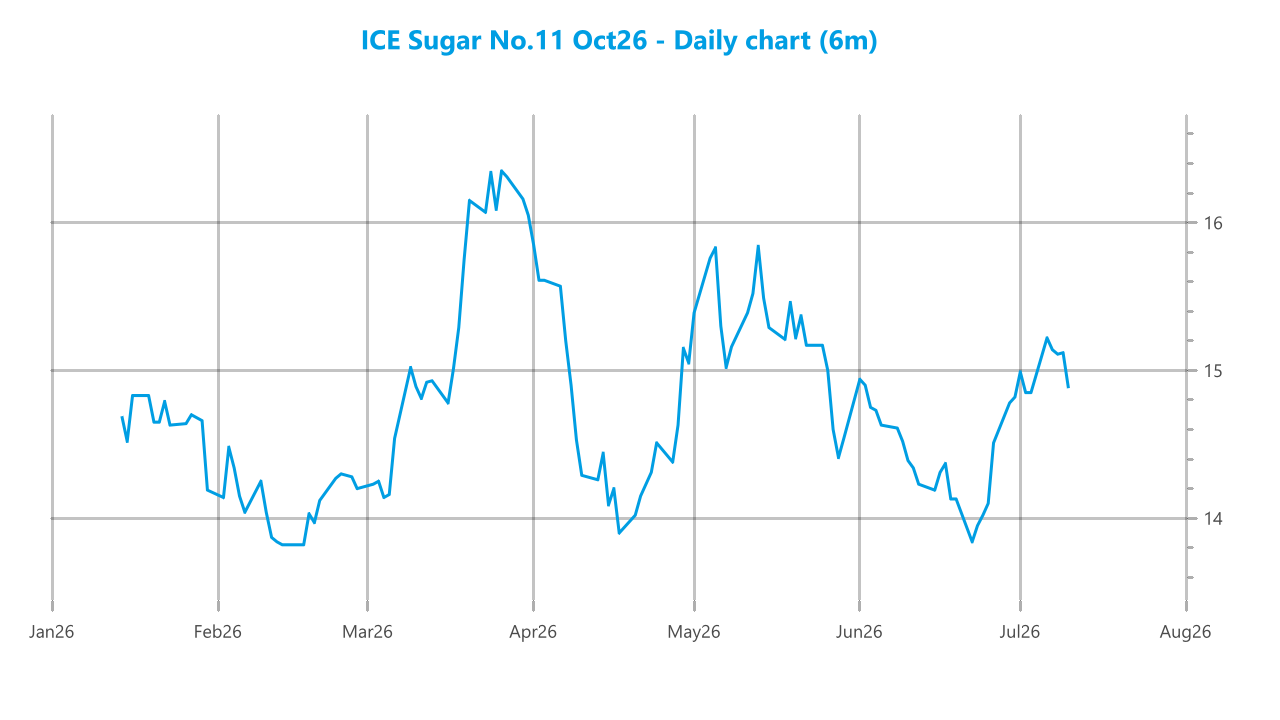
The week started with Oct’26 swinging either side of 14.88 during the opening minutes as traders covered in weekend physical requirements. The picture soon began to calm, and as it did so the direction of travel turned to the downside with prices slipping back through the 14.70’s. The latest COT report on Friday showed another week of position reduction from the specs, with 35,000 lots of shorts covered back to now stand the net short position at -57,529 lots, and with the market having still struggled to move away from 15.00 it suggests a good deal of this cover was taken against grower pricing. The market continued to languish through the rest of the morning, and while some buying followed as the US morning commenced, it served only to erase the losses before drying up. This left the market drifting for a while, though the unconvincing nature of the day eventually drew some fresh spec selling that sent prices back to new daily lows. The market did manage to pull back up from the lows in the last hour and limit the losses with a close at 14.75, though that did not altar the unconvincing nature of the performance.
| Settlement (US$/mt) | Open | High | Low | Last | Volume | O/I | Life High | Life Low | |||
|---|---|---|---|---|---|---|---|---|---|---|---|
| Date | Spread | Date | Spread |
|---|---|---|---|
| Aug26 / Oct26 | 5.30 | Oct26 / Dec26 | 0.10 |
| Aug26 / Dec26 | 5.40 | Dec26 / Mar27 | -2.30 |
| Aug26 / Mar27 | 3.10 | Mar27 / May27 | -1.40 |
| Aug26 / May27 | 1.70 | May27 / Aug27 | 2.60 |
| Date | Premium | Date | Premium |
|---|---|---|---|
| Oct26 / Oct26 | 132.62 | Mar28 / Mar28 | 99.78 |
| Mar27 / Mar27 | 114.76 | May28 / May28 | 106.45 |
| May27 / May27 | 120.57 | Jul28 / Aug28 | 106.12 |
| Jul27 / Aug27 | 117.75 | Oct28 / Oct28 | 101.71 |
| Oct27 / Oct27 | 109.19 | Mar29 / Mar29 | 94.60 |
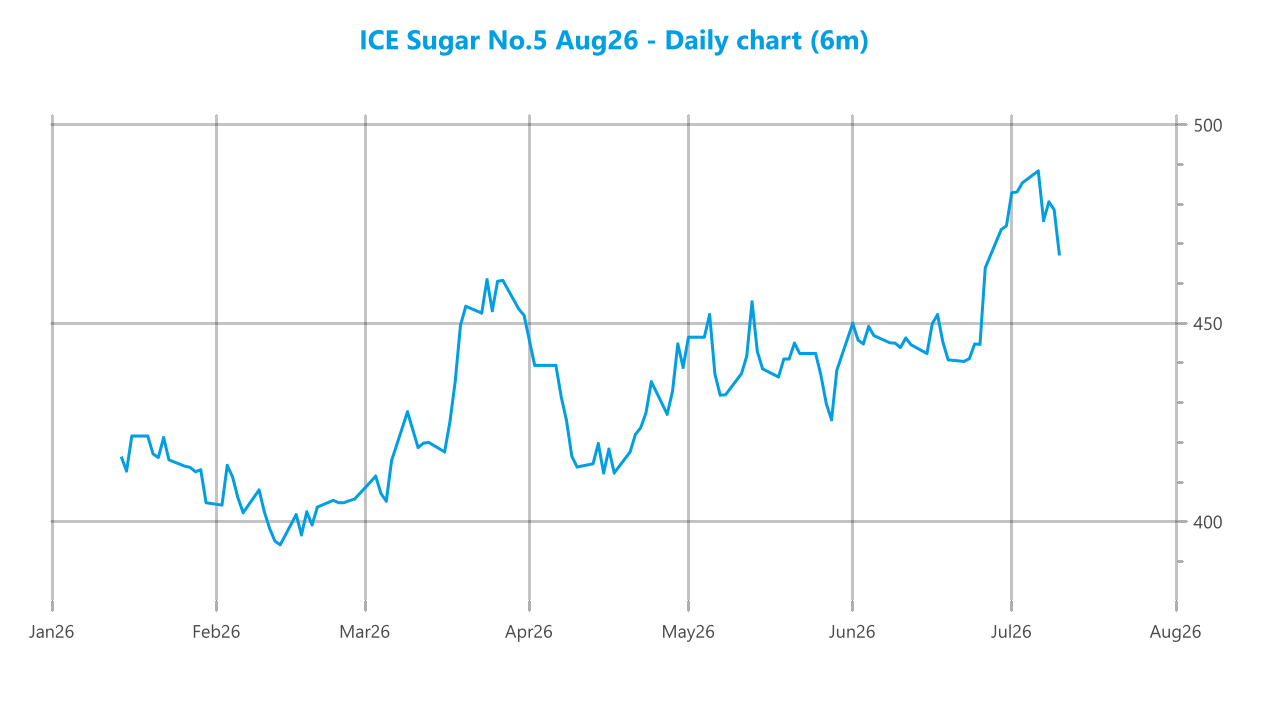
Last weeks performances have dented market confidence, and it was another poor showing that got the new week underway as Oct’26 quickly came under some pressure. Buyers were hard to find as the price tumbled through Fridays lows and down to $455.70, a worrying sign for the longs as more of the gain from late June erodes. The market attempted to dig in through the later part of the morning and then looked back into the range as some day trader covering occurred, however the trend remained weak overall and into the afternoon prices were sat towards the bottom of the range. More selling / long liquidation followed from the specs to send prices lower still as the day wore on, with no sign that there would be any buyers stepping in to arrest the slide. White premium values took a beating as a result with Oct/Oct’26 moving below $130.00, while at the top of the board Aug/Jul’26 was weaker and printed to a small -$0.70 discount before picking back up during the later stages. From a new low mark of $452.60 there was a round of short covering which accelerated the price back through $460, though once completed the final stages saw the price slip again to a settlement level at $457.80.